Galveston SnackAbility
Overall SnackAbility
Crime in Galveston summary. We use data from the FBI to determine the crime rates in Galveston. Key points include:
There were 1,549 total crimes in Galveston in the last reporting year.
The overall crime rate per 100,000 people in Galveston is 2,917.1 / 100k people.
The violent crime rate per 100,000 people in Galveston is 536.7 / 100k people.
The property crime rate per 100,000 people in Galveston is 2,380.4 / 100k people.
Overall, crime in Galveston is 37.65% above the national average.
Total Crimes
Above National Average
Crime In Galveston Comparison Table
| Statistic | Count Raw |
Galveston / 100k People |
Texas / 100k People |
National / 100k People |
|---|---|---|---|---|
| Total Crimes Per 100K | 1,549 | 2,917.1 | 2,429.9 | 2,119.2 |
| Violent Crime | 285 | 536.7 | 389.4 | 359.0 |
| Murder | 3 | 5.6 | 5.2 | 5.0 |
| Robbery | 57 | 107.3 | 63.5 | 61.0 |
| Aggravated Assault | 145 | 273.1 | 270.7 | 256.0 |
| Property Crime | 1,264 | 2,380.4 | 2,040.5 | 1,760.0 |
| Burglary | 139 | 261.8 | 284.3 | 229.0 |
| Larceny | 984 | 1,853.1 | 1,425.6 | 1,272.0 |
| Car Theft | 141 | 265.5 | 330.7 | 259.0 |
Source: FBI Uniform Crime Reporting (2024)
Cost of living in Galveston summary. We use data on the cost of living to determine how expensive it is to live in Galveston. Real estate prices drive most of the variance in cost of living around Texas. Key points include:
The cost of living in Galveston is 102 with 100 being average.
The cost of living in Galveston is 1.0x higher than the national average.
The median home value in Galveston is $320,624.
The median income in Galveston is $55,631.
Galveston's Overall Cost Of Living
Higher Than The National Average
Cost Of Living In Galveston Comparison Table
| Living Expense | Galveston | Texas | National Average |
|---|---|---|---|
| Overall | 102 | 93 | 100 |
| Services | 99 | 100 | 100 |
| Groceries | 98 | 99 | 100 |
| Health | 109 | 81 | 100 |
| Housing | 95 | 97 | 100 |
| Transportation | 103 | 103 | 100 |
| Utilities | 95 | 100 | 100 |
Source: Cost of living index, normalized to US average = 100
Galveston, TX Weather
The average high in Galveston is 76.3° and the average low is 64.5°.
There are 56.6 days of precipitation each year.
Expect an average of 45.7 inches of precipitation each year with 0.0 inches of snow.
| Stat | Galveston |
|---|---|
| Average Annual High | 76.3 |
| Average Annual Low | 64.5 |
| Annual Precipitation Days | 56.6 |
| Average Annual Precipitation | 45.7 |
| Average Annual Snowfall | 0.0 |
Average High
Days of Rain
Source: NOAA climate normals (30-year)
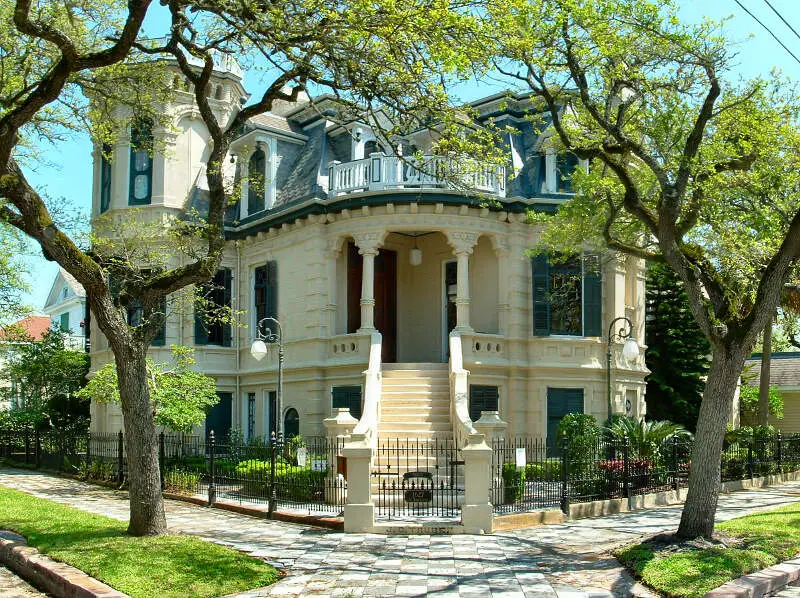
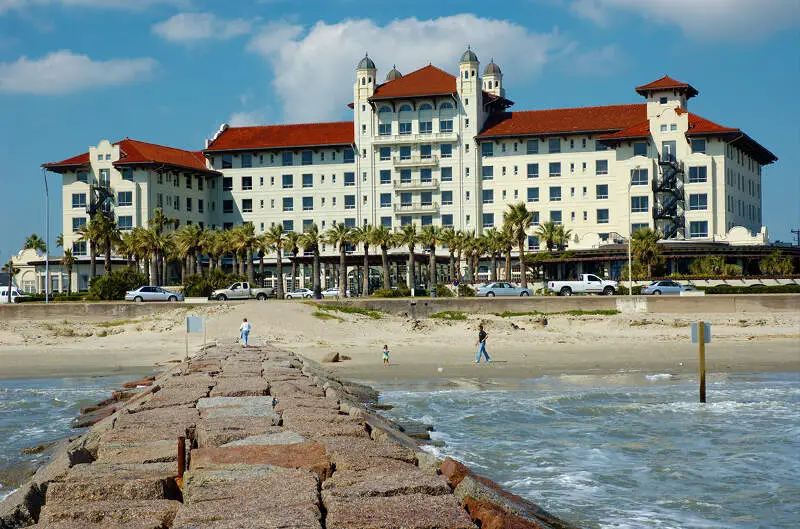
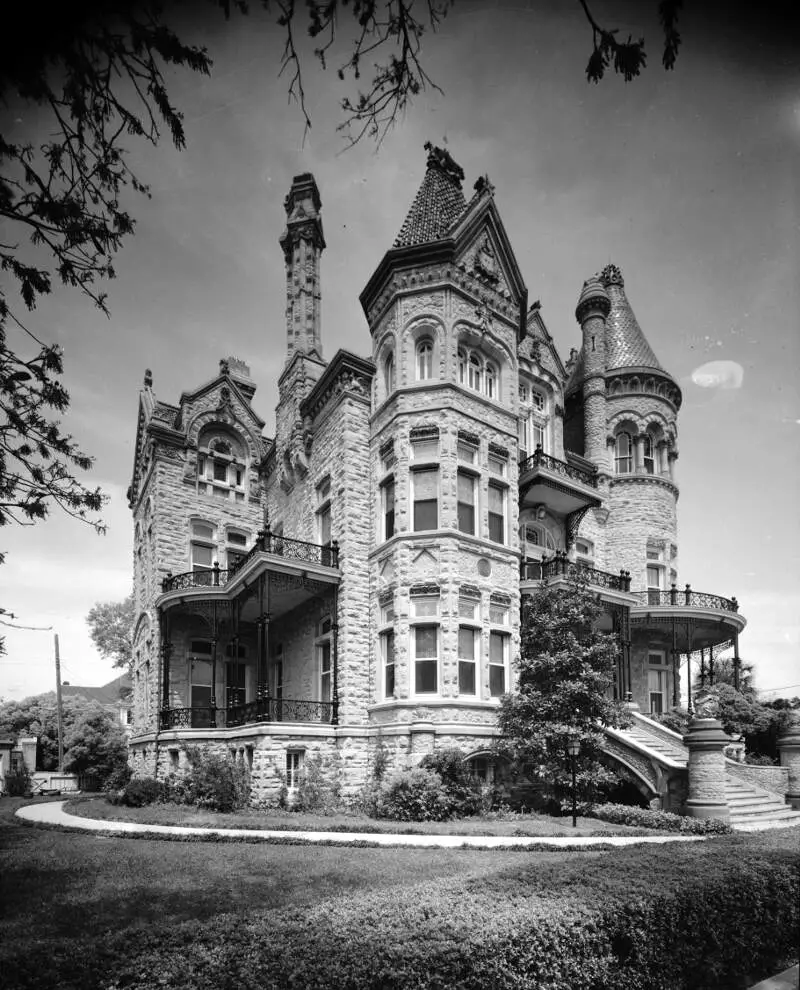
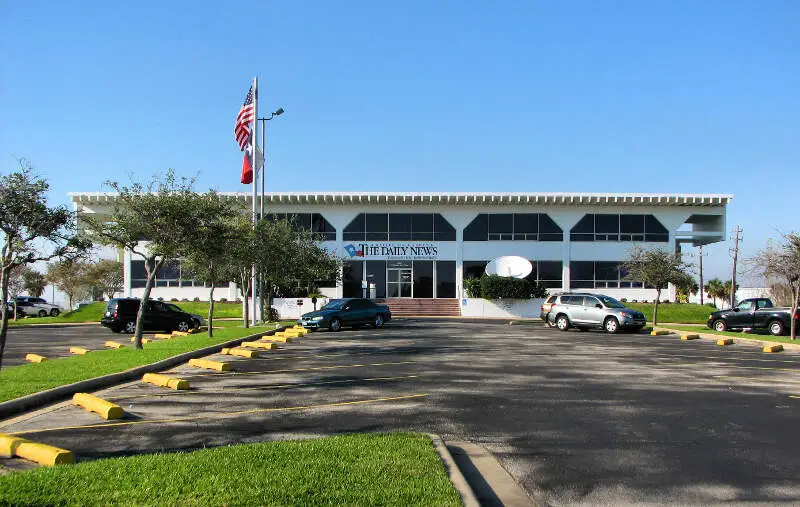
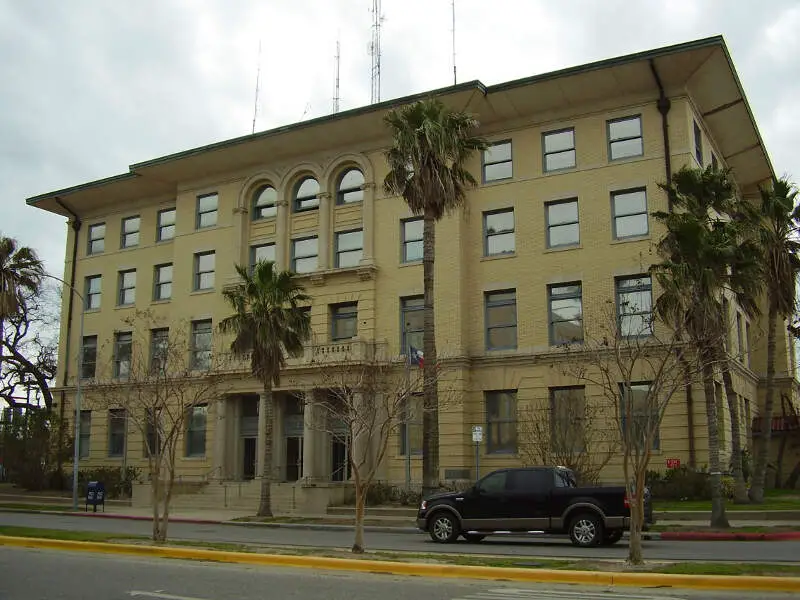
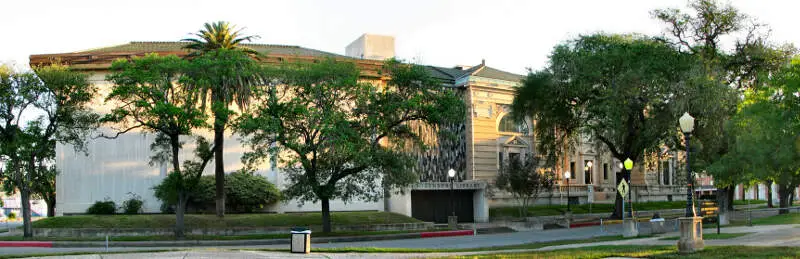
Galveston, TX Photos


6 Reviews & Comments About Galveston

Ok, I live in Houston Texas and I agree with a LOT of these towns. Especially Vidor. But I don't agree with GALVESTON. Yeah, they have a slum area but so does every city in the United States. I've lived in Galveston before and I can't say it's any worse than other towns. The food is great. There are jobs if you want them. The city is clean in most of the areas. We have a HUGE Mardi Gras every year and Dickens On the Strand every December. Most people are friendly. A LOT of people come down to Party during Spring Break but 99% of the idiots that end up in jail are from OTHER city's. The beaches do get crowded but we have Life Guards on duty. So don't let this video keep you from coming to Galveston Texas. You'll have a great time.
I use to live in Galveston and it's not bad! But I have to say that every city has something bad and good so I think it's the day thing tbh now I live in corpus and it's the same
LMAO I LIVE IN GALVESTON AND IT DOES S**K BAD!!! People think that just because they are on a beach that it wont matter if they do something bad because, who cares-
Galveston is not horrible at all and I'm from Texas, and I also live there.
Dude. You're f****d on the head. I live in Galveston and it's awesome.
I love visiting Galveston, TX. There is always something to do. Whether walking around on the strip or walking the beach. The whole place is extremely laid back. You feel like you could be a beach b*m for the reat of your life while you are there.
My favorite things to do in Galveston is going to the strip, the candy store is the best, or riding bikes down the seawall. I have never had an issue with any problems the many times I have visited. Pleasure pier is an amazing place to have fun for the whole family. The Rainforest Cafe is a must visit even if the food isn't great.
Rankings & Articles For Galveston


Locations Around Galveston
Map Of Galveston, TX
Best Places Around Galveston
West University Place, TX
Population 14,982
Bellaire, TX
Population 17,206
Friendswood, TX
Population 41,030
Sugar Land, TX
Population 110,016
Deer Park, TX
Population 33,967
Fresno, TX
Population 24,560
Pearland, TX
Population 127,514
Lake Jackson, TX
Population 27,974
Galveston Demographics And Statistics
Population over time in Galveston
The current population in Galveston is 53,424. The population has increased 6.9% from 2010.
| Year | Population | % Change |
|---|---|---|
| 2024 | 53,424 | 0.1% |
| 2023 | 53,348 | 0.2% |
| 2022 | 53,265 | 0.3% |
| 2021 | 53,092 | 5.5% |
| 2020 | 50,307 | 0.1% |
| 2019 | 50,241 | 0.4% |
| 2018 | 50,039 | 0.7% |
| 2017 | 49,706 | 0.5% |
| 2016 | 49,443 | 1.0% |
| 2015 | 48,971 | 0.9% |
| 2014 | 48,513 | 0.7% |
| 2013 | 48,178 | -0.4% |
| 2012 | 48,352 | -1.8% |
| 2011 | 49,238 | -1.5% |
| 2010 | 49,990 | - |
Race / Ethnicity in Galveston
See the full breakdown
Galveston is:
49.8% White with 26,593 White residents.
15.0% African American with 8,017 African American residents.
0.1% American Indian with 71 American Indian residents.
2.8% Asian with 1,485 Asian residents.
0.3% Hawaiian with 166 Hawaiian residents.
0.5% Other with 287 Other residents.
2.2% Two Or More with 1,162 Two Or More residents.
29.3% Hispanic with 15,643 Hispanic residents.
| Race | Galveston | TX | USA |
|---|---|---|---|
| White | 49.8% | 39.1% | 57.4% |
| African American | 15.0% | 11.9% | 11.9% |
| American Indian | 0.1% | 0.1% | 0.5% |
| Asian | 2.8% | 5.5% | 5.9% |
| Hawaiian | 0.3% | 0.1% | 0.2% |
| Other | 0.5% | 0.4% | 0.6% |
| Two Or More | 2.2% | 3.1% | 4.3% |
| Hispanic | 29.3% | 39.7% | 19.3% |
Gender in Galveston
See the full breakdown
Galveston is 49.4% female with 26,404 female residents.
Galveston is 50.6% male with 27,019 male residents.
| Gender | Galveston | TX | USA |
|---|---|---|---|
| Female | 49.4% | 50.1% | 50.5% |
| Male | 50.6% | 49.9% | 49.5% |
Highest level of educational attainment in Galveston for adults over 25
See the full breakdown
5.0% of adults in Galveston completed < 9th grade.
7.0% of adults in Galveston completed 9-12th grade.
23.0% of adults in Galveston completed high school / ged.
21.0% of adults in Galveston completed some college.
8.0% of adults in Galveston completed associate's degree.
21.0% of adults in Galveston completed bachelor's degree.
8.0% of adults in Galveston completed master's degree.
4.0% of adults in Galveston completed professional degree.
3.0% of adults in Galveston completed doctorate degree.
| Education | Galveston | TX | USA |
|---|---|---|---|
| < 9th Grade | 5.0% | 8.0% | 4.0% |
| 9-12th Grade | 7.0% | 7.0% | 6.0% |
| High School / GED | 23.0% | 24.0% | 26.0% |
| Some College | 21.0% | 20.0% | 19.0% |
| Associate's Degree | 8.0% | 8.0% | 9.0% |
| Bachelor's Degree | 21.0% | 21.0% | 22.0% |
| Master's Degree | 8.0% | 9.0% | 10.0% |
| Professional Degree | 4.0% | 2.0% | 2.0% |
| Doctorate Degree | 3.0% | 1.0% | 2.0% |
Household Income For Galveston, Texas
See the full breakdown
9.8% of households in Galveston earn Less than $10,000.
5.4% of households in Galveston earn $10,000 to $14,999.
9.5% of households in Galveston earn $15,000 to $24,999.
9.8% of households in Galveston earn $25,000 to $34,999.
11.9% of households in Galveston earn $35,000 to $49,999.
14.7% of households in Galveston earn $50,000 to $74,999.
9.6% of households in Galveston earn $75,000 to $99,999.
13.0% of households in Galveston earn $100,000 to $149,999.
6.7% of households in Galveston earn $150,000 to $199,999.
9.4% of households in Galveston earn $200,000 or more.
| Income | Galveston | TX | USA |
|---|---|---|---|
| Less than $10,000 | 9.8% | 5.0% | 5.0% |
| $10,000 to $14,999 | 5.4% | 3.3% | 3.4% |
| $15,000 to $24,999 | 9.5% | 6.3% | 6.3% |
| $25,000 to $34,999 | 9.8% | 6.8% | 6.6% |
| $35,000 to $49,999 | 11.9% | 10.5% | 10.1% |
| $50,000 to $74,999 | 14.7% | 16.1% | 15.5% |
| $75,000 to $99,999 | 9.6% | 12.8% | 12.6% |
| $100,000 to $149,999 | 13.0% | 17.3% | 17.5% |
| $150,000 to $199,999 | 6.7% | 9.5% | 9.6% |
| $200,000 or more | 9.4% | 12.5% | 13.4% |
Source: U.S. Census ACS 5-year estimates (2024)


