Granbury SnackAbility
Overall SnackAbility
Crime in Granbury summary. We use data from the FBI to determine the crime rates in Granbury. Key points include:
There were 493 total crimes in Granbury in the last reporting year.
The overall crime rate per 100,000 people in Granbury is 3,735.1 / 100k people.
The violent crime rate per 100,000 people in Granbury is 227.3 / 100k people.
The property crime rate per 100,000 people in Granbury is 3,507.8 / 100k people.
Overall, crime in Granbury is 76.25% above the national average.
Total Crimes
Above National Average
Crime In Granbury Comparison Table
| Statistic | Count Raw |
Granbury / 100k People |
Texas / 100k People |
National / 100k People |
|---|---|---|---|---|
| Total Crimes Per 100K | 493 | 3,735.1 | 2,429.9 | 2,119.2 |
| Violent Crime | 30 | 227.3 | 389.4 | 359.0 |
| Murder | 0 | 0.0 | 5.2 | 5.0 |
| Robbery | 1 | 7.6 | 63.5 | 61.0 |
| Aggravated Assault | 20 | 151.5 | 270.7 | 256.0 |
| Property Crime | 463 | 3,507.8 | 2,040.5 | 1,760.0 |
| Burglary | 12 | 90.9 | 284.3 | 229.0 |
| Larceny | 431 | 3,265.4 | 1,425.6 | 1,272.0 |
| Car Theft | 20 | 151.5 | 330.7 | 259.0 |
Source: FBI Uniform Crime Reporting (2024)
Cost of living in Granbury summary. We use data on the cost of living to determine how expensive it is to live in Granbury. Real estate prices drive most of the variance in cost of living around Texas. Key points include:
The cost of living in Granbury is 106 with 100 being average.
The cost of living in Granbury is 1.1x higher than the national average.
The median home value in Granbury is $368,650.
The median income in Granbury is $73,516.
Granbury's Overall Cost Of Living
Higher Than The National Average
Cost Of Living In Granbury Comparison Table
| Living Expense | Granbury | Texas | National Average |
|---|---|---|---|
| Overall | 106 | 93 | 100 |
| Services | 98 | 100 | 100 |
| Groceries | 94 | 99 | 100 |
| Health | 117 | 81 | 100 |
| Housing | 96 | 97 | 100 |
| Transportation | 105 | 103 | 100 |
| Utilities | 98 | 100 | 100 |
Source: Cost of living index, normalized to US average = 100
Granbury, TX Weather
The average high in Granbury is 77.8° and the average low is 53.2°.
There are 46.7 days of precipitation each year.
Expect an average of 34.9 inches of precipitation each year with 0.4 inches of snow.
| Stat | Granbury |
|---|---|
| Average Annual High | 77.8 |
| Average Annual Low | 53.2 |
| Annual Precipitation Days | 46.7 |
| Average Annual Precipitation | 34.9 |
| Average Annual Snowfall | 0.4 |
Average High
Days of Rain
Source: NOAA climate normals (30-year)
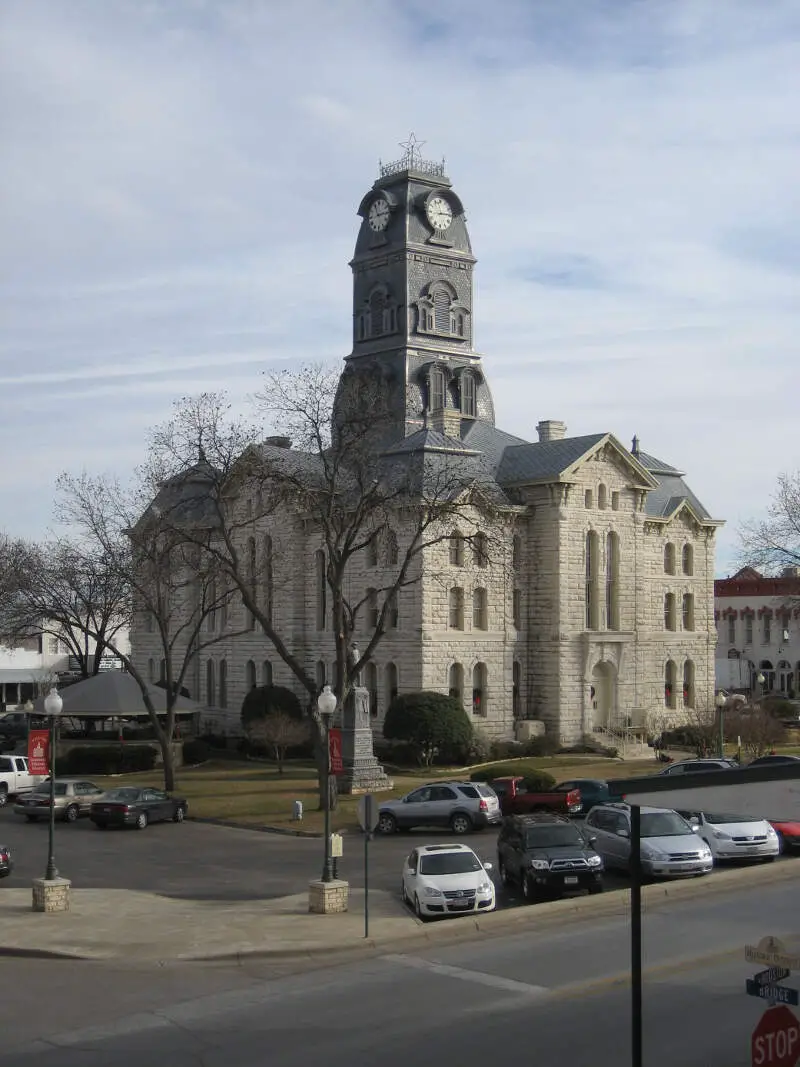
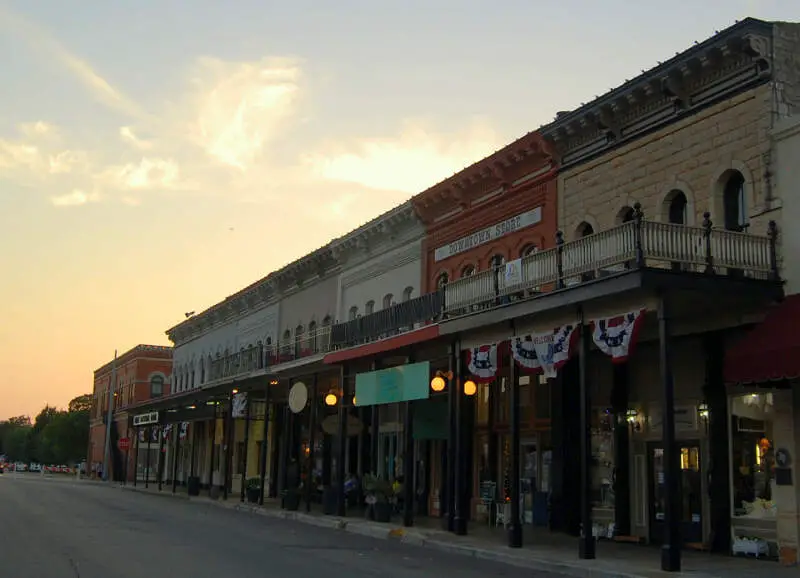
Granbury, TX Photos


Rankings & Articles For Granbury


Locations Around Granbury
Map Of Granbury, TX
Best Places Around Granbury
Keller, TX
Population 45,976
Colleyville, TX
Population 26,012
Bedford, TX
Population 49,085
Watauga, TX
Population 23,233
Saginaw, TX
Population 24,970
Mansfield, TX
Population 77,510
North Richland Hills, TX
Population 70,780
Hurst, TX
Population 39,861
Burleson, TX
Population 52,918
Stephenville, TX
Population 21,682
Granbury Demographics And Statistics
Population over time in Granbury
The current population in Granbury is 12,136. The population has increased 56.4% from 2010.
| Year | Population | % Change |
|---|---|---|
| 2024 | 12,136 | 4.0% |
| 2023 | 11,665 | 4.0% |
| 2022 | 11,218 | 7.3% |
| 2021 | 10,453 | 1.2% |
| 2020 | 10,325 | 3.9% |
| 2019 | 9,939 | 3.6% |
| 2018 | 9,593 | 3.6% |
| 2017 | 9,257 | 2.3% |
| 2016 | 9,052 | 3.5% |
| 2015 | 8,750 | 3.0% |
| 2014 | 8,496 | 2.8% |
| 2013 | 8,266 | 2.7% |
| 2012 | 8,047 | 2.1% |
| 2011 | 7,881 | 1.6% |
| 2010 | 7,758 | - |
Race / Ethnicity in Granbury
See the full breakdown
Granbury is:
84.8% White with 10,289 White residents.
1.2% African American with 150 African American residents.
0.1% American Indian with 13 American Indian residents.
1.0% Asian with 118 Asian residents.
0.1% Hawaiian with 18 Hawaiian residents.
0.0% Other with 0 Other residents.
3.0% Two Or More with 360 Two Or More residents.
9.8% Hispanic with 1,188 Hispanic residents.
| Race | Granbury | TX | USA |
|---|---|---|---|
| White | 84.8% | 39.1% | 57.4% |
| African American | 1.2% | 11.9% | 11.9% |
| American Indian | 0.1% | 0.1% | 0.5% |
| Asian | 1.0% | 5.5% | 5.9% |
| Hawaiian | 0.1% | 0.1% | 0.2% |
| Other | 0.0% | 0.4% | 0.6% |
| Two Or More | 3.0% | 3.1% | 4.3% |
| Hispanic | 9.8% | 39.7% | 19.3% |
Gender in Granbury
See the full breakdown
Granbury is 55.0% female with 6,670 female residents.
Granbury is 45.0% male with 5,466 male residents.
| Gender | Granbury | TX | USA |
|---|---|---|---|
| Female | 55.0% | 50.1% | 50.5% |
| Male | 45.0% | 49.9% | 49.5% |
Highest level of educational attainment in Granbury for adults over 25
See the full breakdown
3.0% of adults in Granbury completed < 9th grade.
6.0% of adults in Granbury completed 9-12th grade.
28.0% of adults in Granbury completed high school / ged.
27.0% of adults in Granbury completed some college.
5.0% of adults in Granbury completed associate's degree.
24.0% of adults in Granbury completed bachelor's degree.
6.0% of adults in Granbury completed master's degree.
0.0% of adults in Granbury completed professional degree.
1.0% of adults in Granbury completed doctorate degree.
| Education | Granbury | TX | USA |
|---|---|---|---|
| < 9th Grade | 3.0% | 8.0% | 4.0% |
| 9-12th Grade | 6.0% | 7.0% | 6.0% |
| High School / GED | 28.0% | 24.0% | 26.0% |
| Some College | 27.0% | 20.0% | 19.0% |
| Associate's Degree | 5.0% | 8.0% | 9.0% |
| Bachelor's Degree | 24.0% | 21.0% | 22.0% |
| Master's Degree | 6.0% | 9.0% | 10.0% |
| Professional Degree | 0.0% | 2.0% | 2.0% |
| Doctorate Degree | 1.0% | 1.0% | 2.0% |
Household Income For Granbury, Texas
See the full breakdown
2.4% of households in Granbury earn Less than $10,000.
2.4% of households in Granbury earn $10,000 to $14,999.
8.5% of households in Granbury earn $15,000 to $24,999.
8.8% of households in Granbury earn $25,000 to $34,999.
11.4% of households in Granbury earn $35,000 to $49,999.
18.0% of households in Granbury earn $50,000 to $74,999.
10.4% of households in Granbury earn $75,000 to $99,999.
24.6% of households in Granbury earn $100,000 to $149,999.
5.4% of households in Granbury earn $150,000 to $199,999.
8.0% of households in Granbury earn $200,000 or more.
| Income | Granbury | TX | USA |
|---|---|---|---|
| Less than $10,000 | 2.4% | 5.0% | 5.0% |
| $10,000 to $14,999 | 2.4% | 3.3% | 3.4% |
| $15,000 to $24,999 | 8.5% | 6.3% | 6.3% |
| $25,000 to $34,999 | 8.8% | 6.8% | 6.6% |
| $35,000 to $49,999 | 11.4% | 10.5% | 10.1% |
| $50,000 to $74,999 | 18.0% | 16.1% | 15.5% |
| $75,000 to $99,999 | 10.4% | 12.8% | 12.6% |
| $100,000 to $149,999 | 24.6% | 17.3% | 17.5% |
| $150,000 to $199,999 | 5.4% | 9.5% | 9.6% |
| $200,000 or more | 8.0% | 12.5% | 13.4% |
Source: U.S. Census ACS 5-year estimates (2024)


