Grand Prairie SnackAbility
Overall SnackAbility
Crime in Grand Prairie summary. We use data from the FBI to determine the crime rates in Grand Prairie. Key points include:
There were 3,756 total crimes in Grand Prairie in the last reporting year.
The overall crime rate per 100,000 people in Grand Prairie is 1,822.2 / 100k people.
The violent crime rate per 100,000 people in Grand Prairie is 221.2 / 100k people.
The property crime rate per 100,000 people in Grand Prairie is 1,601.0 / 100k people.
Overall, crime in Grand Prairie is -14.02% below the national average.
Total Crimes
Below National Average
Crime In Grand Prairie Comparison Table
| Statistic | Count Raw |
Grand Prairie / 100k People |
Texas / 100k People |
National / 100k People |
|---|---|---|---|---|
| Total Crimes Per 100K | 3,756 | 1,822.2 | 2,429.9 | 2,119.2 |
| Violent Crime | 456 | 221.2 | 389.4 | 359.0 |
| Murder | 4 | 1.9 | 5.2 | 5.0 |
| Robbery | 58 | 28.1 | 63.5 | 61.0 |
| Aggravated Assault | 353 | 171.3 | 270.7 | 256.0 |
| Property Crime | 3,300 | 1,601.0 | 2,040.5 | 1,760.0 |
| Burglary | 323 | 156.7 | 284.3 | 229.0 |
| Larceny | 2,366 | 1,147.9 | 1,425.6 | 1,272.0 |
| Car Theft | 611 | 296.4 | 330.7 | 259.0 |
Source: FBI Uniform Crime Reporting (2024)
Cost of living in Grand Prairie summary. We use data on the cost of living to determine how expensive it is to live in Grand Prairie. Real estate prices drive most of the variance in cost of living around Texas. Key points include:
The cost of living in Grand Prairie is 101 with 100 being average.
The cost of living in Grand Prairie is 1.0x higher than the national average.
The median home value in Grand Prairie is $316,526.
The median income in Grand Prairie is $81,619.
Grand Prairie's Overall Cost Of Living
Higher Than The National Average
Cost Of Living In Grand Prairie Comparison Table
| Living Expense | Grand Prairie | Texas | National Average |
|---|---|---|---|
| Overall | 101 | 93 | 100 |
| Services | 100 | 100 | 100 |
| Groceries | 99 | 99 | 100 |
| Health | 103 | 81 | 100 |
| Housing | 102 | 97 | 100 |
| Transportation | 102 | 103 | 100 |
| Utilities | 95 | 100 | 100 |
Source: Cost of living index, normalized to US average = 100
Grand Prairie, TX Weather
The average high in Grand Prairie is 76.9° and the average low is 55.9°.
There are 54.3 days of precipitation each year.
Expect an average of 37.6 inches of precipitation each year with 0.9 inches of snow.
| Stat | Grand Prairie |
|---|---|
| Average Annual High | 76.9 |
| Average Annual Low | 55.9 |
| Annual Precipitation Days | 54.3 |
| Average Annual Precipitation | 37.6 |
| Average Annual Snowfall | 0.9 |
Average High
Days of Rain
Source: NOAA climate normals (30-year)
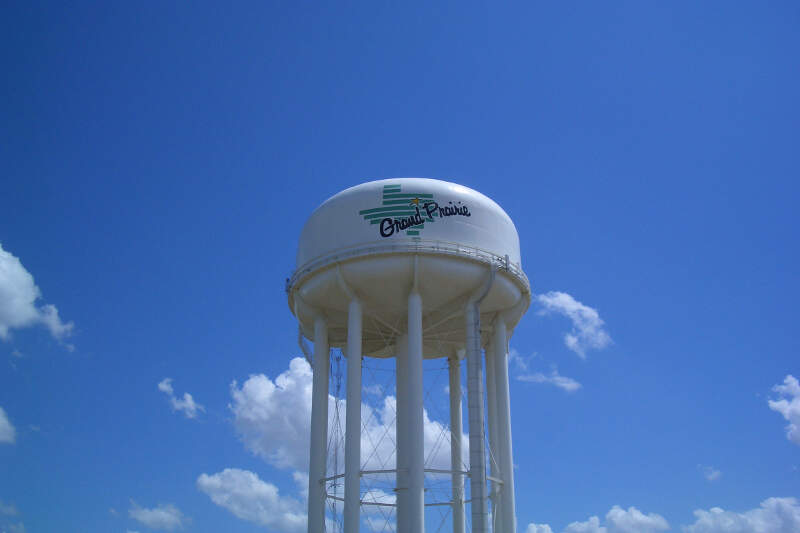
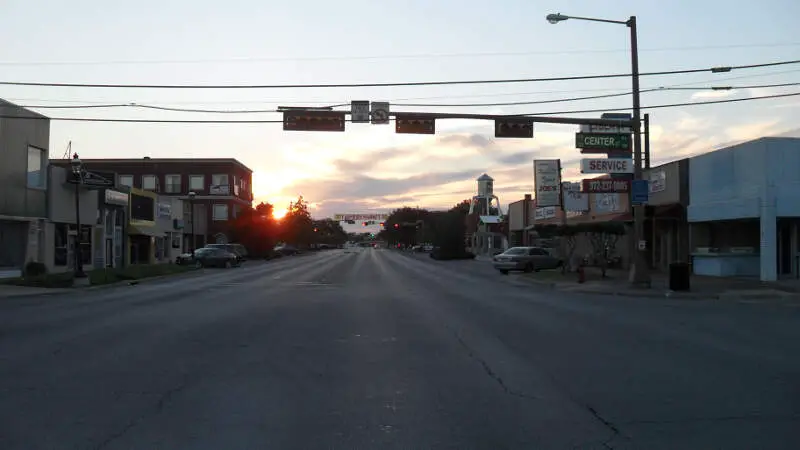
Grand Prairie, TX Photos


1 Reviews & Comments About Grand Prairie

The school district has been lousy for years, and now it is so bad they advertise to attract outside students because so many who live there attend private school, home school or try to get OUT of the district.
The southern area around Joe Pool lake is safer and upscale, but I worry it will eventually deteriorate, too. They're trying to promote amenities like the race track while ignoring basic issues like safety and quality of schools.
The way they handled the 161 extension was terrible. They spent years getting it through, but they didn't use that time to buy up land as people moved out and sold. So people who didn't know about the proposed project bought land, built homes only to lose it to eminent domain 5 years later though the project had been theoretical for 20 years. Bad city management
Crime has been worsening over time in the northern urbanizing area. Not all demographic shifts are for the better.
Rankings & Articles For Grand Prairie


Locations Around Grand Prairie
Map Of Grand Prairie, TX
Best Places Around Grand Prairie
University Park, TX
Population 25,155
Coppell, TX
Population 42,154
Colleyville, TX
Population 26,012
Bedford, TX
Population 49,085
Watauga, TX
Population 23,233
Grapevine, TX
Population 51,139
Mansfield, TX
Population 77,510
Farmers Branch, TX
Population 36,645
North Richland Hills, TX
Population 70,780
Hurst, TX
Population 39,861
Grand Prairie Demographics And Statistics
Population over time in Grand Prairie
The current population in Grand Prairie is 201,883. The population has increased 21.8% from 2010.
| Year | Population | % Change |
|---|---|---|
| 2024 | 201,883 | 1.7% |
| 2023 | 198,564 | 0.7% |
| 2022 | 197,279 | 0.7% |
| 2021 | 195,992 | 1.1% |
| 2020 | 193,835 | 0.7% |
| 2019 | 192,565 | 0.8% |
| 2018 | 191,104 | 1.3% |
| 2017 | 188,664 | 1.6% |
| 2016 | 185,631 | 1.2% |
| 2015 | 183,500 | 1.3% |
| 2014 | 181,135 | 1.6% |
| 2013 | 178,195 | 2.0% |
| 2012 | 174,631 | 2.4% |
| 2011 | 170,467 | 2.8% |
| 2010 | 165,776 | - |
Race / Ethnicity in Grand Prairie
See the full breakdown
Grand Prairie is:
18.7% White with 37,715 White residents.
24.8% African American with 50,048 African American residents.
0.2% American Indian with 306 American Indian residents.
6.9% Asian with 13,961 Asian residents.
0.0% Hawaiian with 98 Hawaiian residents.
0.5% Other with 917 Other residents.
2.4% Two Or More with 4,754 Two Or More residents.
46.6% Hispanic with 94,084 Hispanic residents.
| Race | Grand Prairie | TX | USA |
|---|---|---|---|
| White | 18.7% | 39.1% | 57.4% |
| African American | 24.8% | 11.9% | 11.9% |
| American Indian | 0.2% | 0.1% | 0.5% |
| Asian | 6.9% | 5.5% | 5.9% |
| Hawaiian | 0.0% | 0.1% | 0.2% |
| Other | 0.5% | 0.4% | 0.6% |
| Two Or More | 2.4% | 3.1% | 4.3% |
| Hispanic | 46.6% | 39.7% | 19.3% |
Gender in Grand Prairie
See the full breakdown
Grand Prairie is 50.8% female with 102,475 female residents.
Grand Prairie is 49.2% male with 99,407 male residents.
| Gender | Grand Prairie | TX | USA |
|---|---|---|---|
| Female | 50.8% | 50.1% | 50.5% |
| Male | 49.2% | 49.9% | 49.5% |
Highest level of educational attainment in Grand Prairie for adults over 25
See the full breakdown
10.0% of adults in Grand Prairie completed < 9th grade.
8.0% of adults in Grand Prairie completed 9-12th grade.
25.0% of adults in Grand Prairie completed high school / ged.
19.0% of adults in Grand Prairie completed some college.
8.0% of adults in Grand Prairie completed associate's degree.
21.0% of adults in Grand Prairie completed bachelor's degree.
7.0% of adults in Grand Prairie completed master's degree.
1.0% of adults in Grand Prairie completed professional degree.
1.0% of adults in Grand Prairie completed doctorate degree.
| Education | Grand Prairie | TX | USA |
|---|---|---|---|
| < 9th Grade | 10.0% | 8.0% | 4.0% |
| 9-12th Grade | 8.0% | 7.0% | 6.0% |
| High School / GED | 25.0% | 24.0% | 26.0% |
| Some College | 19.0% | 20.0% | 19.0% |
| Associate's Degree | 8.0% | 8.0% | 9.0% |
| Bachelor's Degree | 21.0% | 21.0% | 22.0% |
| Master's Degree | 7.0% | 9.0% | 10.0% |
| Professional Degree | 1.0% | 2.0% | 2.0% |
| Doctorate Degree | 1.0% | 1.0% | 2.0% |
Household Income For Grand Prairie, Texas
See the full breakdown
3.6% of households in Grand Prairie earn Less than $10,000.
2.4% of households in Grand Prairie earn $10,000 to $14,999.
4.6% of households in Grand Prairie earn $15,000 to $24,999.
6.1% of households in Grand Prairie earn $25,000 to $34,999.
11.0% of households in Grand Prairie earn $35,000 to $49,999.
18.2% of households in Grand Prairie earn $50,000 to $74,999.
13.5% of households in Grand Prairie earn $75,000 to $99,999.
20.7% of households in Grand Prairie earn $100,000 to $149,999.
10.3% of households in Grand Prairie earn $150,000 to $199,999.
9.6% of households in Grand Prairie earn $200,000 or more.
| Income | Grand Prairie | TX | USA |
|---|---|---|---|
| Less than $10,000 | 3.6% | 5.0% | 5.0% |
| $10,000 to $14,999 | 2.4% | 3.3% | 3.4% |
| $15,000 to $24,999 | 4.6% | 6.3% | 6.3% |
| $25,000 to $34,999 | 6.1% | 6.8% | 6.6% |
| $35,000 to $49,999 | 11.0% | 10.5% | 10.1% |
| $50,000 to $74,999 | 18.2% | 16.1% | 15.5% |
| $75,000 to $99,999 | 13.5% | 12.8% | 12.6% |
| $100,000 to $149,999 | 20.7% | 17.3% | 17.5% |
| $150,000 to $199,999 | 10.3% | 9.5% | 9.6% |
| $200,000 or more | 9.6% | 12.5% | 13.4% |
Source: U.S. Census ACS 5-year estimates (2024)


