Huntsville SnackAbility
Overall SnackAbility
Crime in Huntsville summary. We use data from the FBI to determine the crime rates in Huntsville. Key points include:
There were 1,011 total crimes in Huntsville in the last reporting year.
The overall crime rate per 100,000 people in Huntsville is 2,044.7 / 100k people.
The violent crime rate per 100,000 people in Huntsville is 513.7 / 100k people.
The property crime rate per 100,000 people in Huntsville is 1,531.0 / 100k people.
Overall, crime in Huntsville is -3.52% below the national average.
Total Crimes
Below National Average
Crime In Huntsville Comparison Table
| Statistic | Count Raw |
Huntsville / 100k People |
Texas / 100k People |
National / 100k People |
|---|---|---|---|---|
| Total Crimes Per 100K | 1,011 | 2,044.7 | 2,429.9 | 2,119.2 |
| Violent Crime | 254 | 513.7 | 389.4 | 359.0 |
| Murder | 3 | 6.1 | 5.2 | 5.0 |
| Robbery | 25 | 50.6 | 63.5 | 61.0 |
| Aggravated Assault | 209 | 422.7 | 270.7 | 256.0 |
| Property Crime | 757 | 1,531.0 | 2,040.5 | 1,760.0 |
| Burglary | 95 | 192.1 | 284.3 | 229.0 |
| Larceny | 589 | 1,191.2 | 1,425.6 | 1,272.0 |
| Car Theft | 73 | 147.6 | 330.7 | 259.0 |
Source: FBI Uniform Crime Reporting (2024)
Cost of living in Huntsville summary. We use data on the cost of living to determine how expensive it is to live in Huntsville. Real estate prices drive most of the variance in cost of living around Texas. Key points include:
The cost of living in Huntsville is 97 with 100 being average.
The cost of living in Huntsville is 1.0x lower than the national average.
The median home value in Huntsville is $256,177.
The median income in Huntsville is $47,529.
Huntsville's Overall Cost Of Living
Lower Than The National Average
Cost Of Living In Huntsville Comparison Table
| Living Expense | Huntsville | Texas | National Average |
|---|---|---|---|
| Overall | 97 | 93 | 100 |
| Services | 98 | 100 | 100 |
| Groceries | 98 | 99 | 100 |
| Health | 95 | 81 | 100 |
| Housing | 99 | 97 | 100 |
| Transportation | 105 | 103 | 100 |
| Utilities | 95 | 100 | 100 |
Source: Cost of living index, normalized to US average = 100
Huntsville, TX Weather
The average high in Huntsville is 78.1° and the average low is 56.6°.
There are 65.9 days of precipitation each year.
Expect an average of 48.1 inches of precipitation each year with 0.0 inches of snow.
| Stat | Huntsville |
|---|---|
| Average Annual High | 78.1 |
| Average Annual Low | 56.6 |
| Annual Precipitation Days | 65.9 |
| Average Annual Precipitation | 48.1 |
| Average Annual Snowfall | 0.0 |
Average High
Days of Rain
Source: NOAA climate normals (30-year)
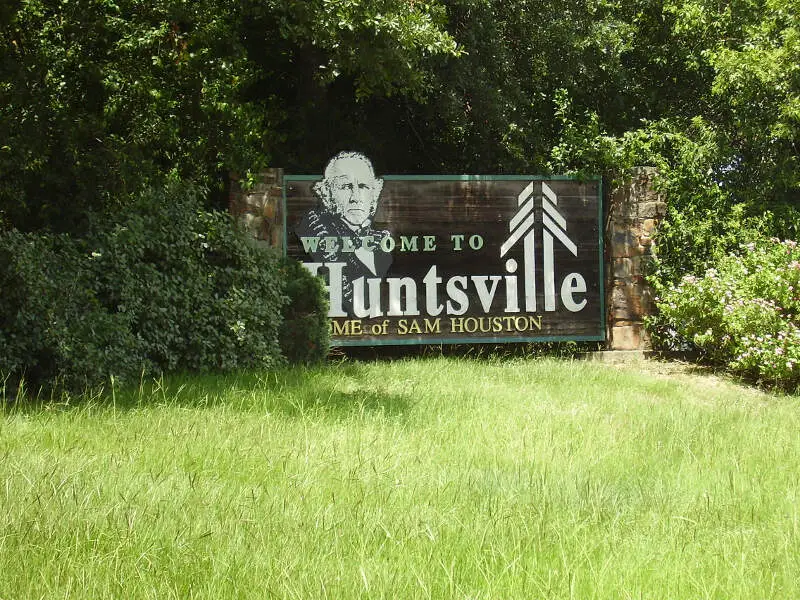
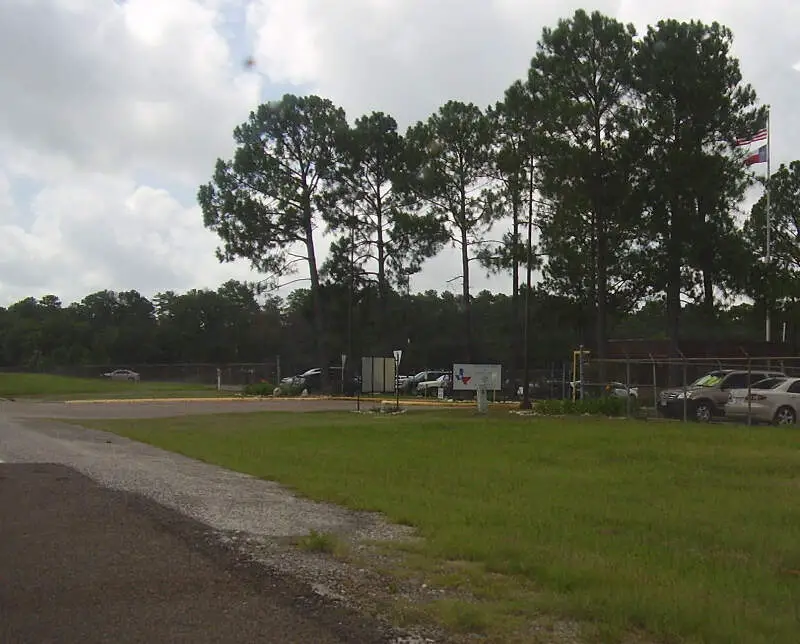
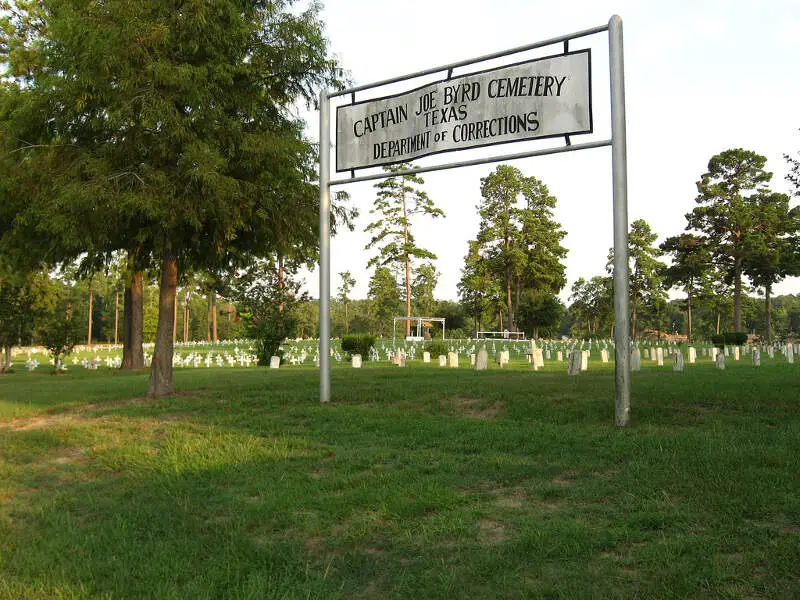
Huntsville, TX Photos
1 Reviews & Comments About Huntsville

This a good family-friendly place to raise kids and start a family. When I first came to Huntsville it was barely any shopping places. It is a small town so everyone knows everybody. I really like it even though trees are everywhere and it looks like a forest it is really nice.
There are deer everywhere. Its a nice town with good places to eat.
Rankings & Articles For Huntsville


Locations Around Huntsville
Map Of Huntsville, TX
Best Places Around Huntsville
The Woodlands, TX
Population 121,002
Spring, TX
Population 68,580
College Station, TX
Population 124,570
Bryan, TX
Population 87,939
Conroe, TX
Population 102,360
Tomball, TX
Population 13,655
Huntsville Demographics And Statistics
Population over time in Huntsville
The current population in Huntsville is 47,864. The population has increased 26.6% from 2010.
| Year | Population | % Change |
|---|---|---|
| 2024 | 47,864 | 2.0% |
| 2023 | 46,917 | 1.5% |
| 2022 | 46,202 | 1.7% |
| 2021 | 45,446 | 9.1% |
| 2020 | 41,664 | 0.2% |
| 2019 | 41,592 | 1.2% |
| 2018 | 41,079 | 0.9% |
| 2017 | 40,727 | 0.7% |
| 2016 | 40,432 | 0.8% |
| 2015 | 40,129 | 0.9% |
| 2014 | 39,764 | 1.5% |
| 2013 | 39,159 | 1.2% |
| 2012 | 38,682 | 1.7% |
| 2011 | 38,037 | 0.6% |
| 2010 | 37,807 | - |
Race / Ethnicity in Huntsville
See the full breakdown
Huntsville is:
48.1% White with 23,036 White residents.
22.5% African American with 10,780 African American residents.
0.2% American Indian with 105 American Indian residents.
1.5% Asian with 700 Asian residents.
0.4% Hawaiian with 188 Hawaiian residents.
0.5% Other with 218 Other residents.
3.1% Two Or More with 1,476 Two Or More residents.
23.7% Hispanic with 11,361 Hispanic residents.
| Race | Huntsville | TX | USA |
|---|---|---|---|
| White | 48.1% | 39.1% | 57.4% |
| African American | 22.5% | 11.9% | 11.9% |
| American Indian | 0.2% | 0.1% | 0.5% |
| Asian | 1.5% | 5.5% | 5.9% |
| Hawaiian | 0.4% | 0.1% | 0.2% |
| Other | 0.5% | 0.4% | 0.6% |
| Two Or More | 3.1% | 3.1% | 4.3% |
| Hispanic | 23.7% | 39.7% | 19.3% |
Gender in Huntsville
See the full breakdown
Huntsville is 43.0% female with 20,562 female residents.
Huntsville is 57.0% male with 27,302 male residents.
| Gender | Huntsville | TX | USA |
|---|---|---|---|
| Female | 43.0% | 50.1% | 50.5% |
| Male | 57.0% | 49.9% | 49.5% |
Highest level of educational attainment in Huntsville for adults over 25
See the full breakdown
7.0% of adults in Huntsville completed < 9th grade.
9.0% of adults in Huntsville completed 9-12th grade.
30.0% of adults in Huntsville completed high school / ged.
22.0% of adults in Huntsville completed some college.
8.0% of adults in Huntsville completed associate's degree.
16.0% of adults in Huntsville completed bachelor's degree.
6.0% of adults in Huntsville completed master's degree.
0.0% of adults in Huntsville completed professional degree.
2.0% of adults in Huntsville completed doctorate degree.
| Education | Huntsville | TX | USA |
|---|---|---|---|
| < 9th Grade | 7.0% | 8.0% | 4.0% |
| 9-12th Grade | 9.0% | 7.0% | 6.0% |
| High School / GED | 30.0% | 24.0% | 26.0% |
| Some College | 22.0% | 20.0% | 19.0% |
| Associate's Degree | 8.0% | 8.0% | 9.0% |
| Bachelor's Degree | 16.0% | 21.0% | 22.0% |
| Master's Degree | 6.0% | 9.0% | 10.0% |
| Professional Degree | 0.0% | 2.0% | 2.0% |
| Doctorate Degree | 2.0% | 1.0% | 2.0% |
Household Income For Huntsville, Texas
See the full breakdown
12.0% of households in Huntsville earn Less than $10,000.
4.8% of households in Huntsville earn $10,000 to $14,999.
8.4% of households in Huntsville earn $15,000 to $24,999.
12.9% of households in Huntsville earn $25,000 to $34,999.
16.6% of households in Huntsville earn $35,000 to $49,999.
18.7% of households in Huntsville earn $50,000 to $74,999.
11.7% of households in Huntsville earn $75,000 to $99,999.
7.7% of households in Huntsville earn $100,000 to $149,999.
4.9% of households in Huntsville earn $150,000 to $199,999.
2.1% of households in Huntsville earn $200,000 or more.
| Income | Huntsville | TX | USA |
|---|---|---|---|
| Less than $10,000 | 12.0% | 5.0% | 5.0% |
| $10,000 to $14,999 | 4.8% | 3.3% | 3.4% |
| $15,000 to $24,999 | 8.4% | 6.3% | 6.3% |
| $25,000 to $34,999 | 12.9% | 6.8% | 6.6% |
| $35,000 to $49,999 | 16.6% | 10.5% | 10.1% |
| $50,000 to $74,999 | 18.7% | 16.1% | 15.5% |
| $75,000 to $99,999 | 11.7% | 12.8% | 12.6% |
| $100,000 to $149,999 | 7.7% | 17.3% | 17.5% |
| $150,000 to $199,999 | 4.9% | 9.5% | 9.6% |
| $200,000 or more | 2.1% | 12.5% | 13.4% |
Source: U.S. Census ACS 5-year estimates (2024)


