New Braunfels SnackAbility
Overall SnackAbility
Crime in New Braunfels summary. We use data from the FBI to determine the crime rates in New Braunfels. Key points include:
There were 1,703 total crimes in New Braunfels in the last reporting year.
The overall crime rate per 100,000 people in New Braunfels is 1,439.9 / 100k people.
The violent crime rate per 100,000 people in New Braunfels is 156.4 / 100k people.
The property crime rate per 100,000 people in New Braunfels is 1,283.5 / 100k people.
Overall, crime in New Braunfels is -32.05% below the national average.
Total Crimes
Below National Average
Crime In New Braunfels Comparison Table
| Statistic | Count Raw |
New Braunfels / 100k People |
Texas / 100k People |
National / 100k People |
|---|---|---|---|---|
| Total Crimes Per 100K | 1,703 | 1,439.9 | 2,429.9 | 2,119.2 |
| Violent Crime | 185 | 156.4 | 389.4 | 359.0 |
| Murder | 2 | 1.7 | 5.2 | 5.0 |
| Robbery | 15 | 12.7 | 63.5 | 61.0 |
| Aggravated Assault | 148 | 125.1 | 270.7 | 256.0 |
| Property Crime | 1,518 | 1,283.5 | 2,040.5 | 1,760.0 |
| Burglary | 150 | 126.8 | 284.3 | 229.0 |
| Larceny | 1,243 | 1,051.0 | 1,425.6 | 1,272.0 |
| Car Theft | 125 | 105.7 | 330.7 | 259.0 |
Source: FBI Uniform Crime Reporting (2024)
Cost of living in New Braunfels summary. We use data on the cost of living to determine how expensive it is to live in New Braunfels. Real estate prices drive most of the variance in cost of living around Texas. Key points include:
The cost of living in New Braunfels is 108 with 100 being average.
The cost of living in New Braunfels is 1.1x higher than the national average.
The median home value in New Braunfels is $350,104.
The median income in New Braunfels is $86,021.
New Braunfels's Overall Cost Of Living
Higher Than The National Average
Cost Of Living In New Braunfels Comparison Table
| Living Expense | New Braunfels | Texas | National Average |
|---|---|---|---|
| Overall | 108 | 93 | 100 |
| Services | 95 | 100 | 100 |
| Groceries | 100 | 99 | 100 |
| Health | 131 | 81 | 100 |
| Housing | 97 | 97 | 100 |
| Transportation | 101 | 103 | 100 |
| Utilities | 96 | 100 | 100 |
Source: Cost of living index, normalized to US average = 100
New Braunfels, TX Weather
The average high in New Braunfels is 79.8° and the average low is 57.0°.
There are 48.0 days of precipitation each year.
Expect an average of 34.7 inches of precipitation each year with 0.3 inches of snow.
| Stat | New Braunfels |
|---|---|
| Average Annual High | 79.8 |
| Average Annual Low | 57.0 |
| Annual Precipitation Days | 48.0 |
| Average Annual Precipitation | 34.7 |
| Average Annual Snowfall | 0.3 |
Average High
Days of Rain
Source: NOAA climate normals (30-year)
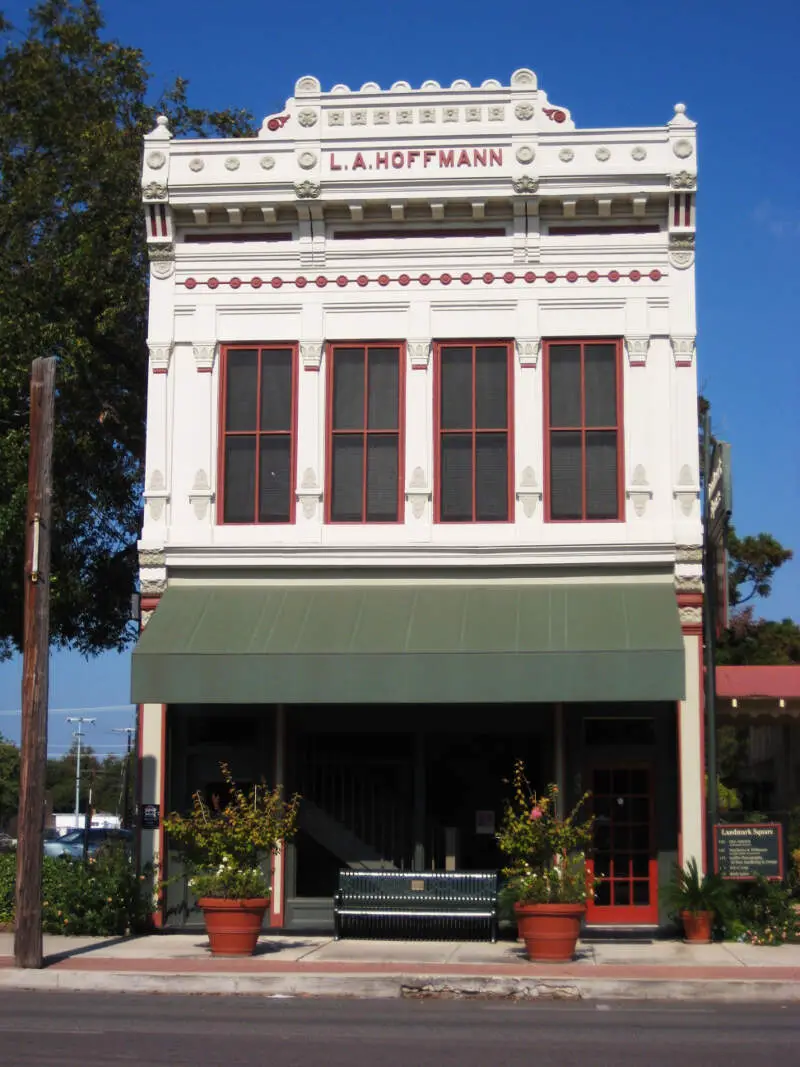
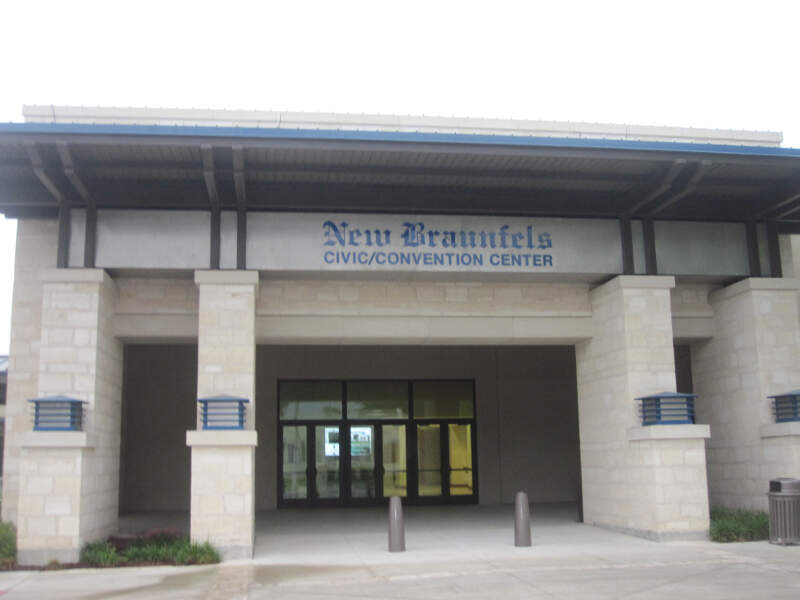
New Braunfels, TX Photos


1 Reviews & Comments About New Braunfels

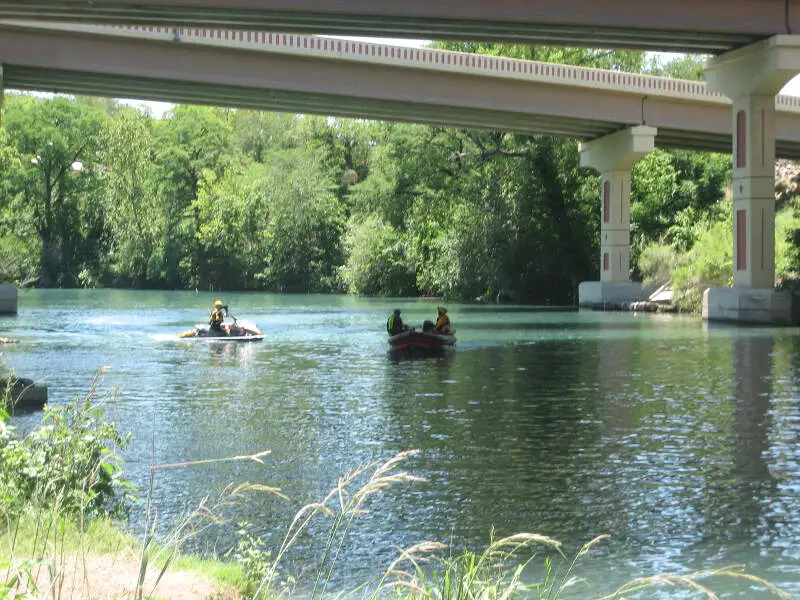
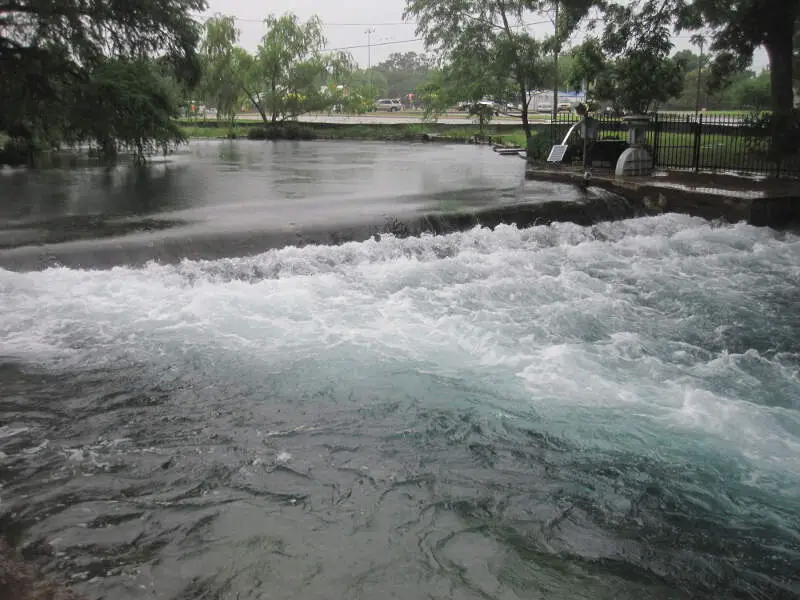
I go to New Braunfels for the Comal and Guadalupe rivers. There's nothing more relaxing than tubing the rivers during the hot Texas summers.
What stands out the most is the beginning of the Comal River which is locate in Landa Park, New Braunfels. The spring-fed river begins here and you can walk right up to the spot where it comes out of the earth and sit there on stone benches that have been carved into the river's wall.
Rankings & Articles For New Braunfels


Locations Around New Braunfels
Map Of New Braunfels, TX
Best Places Around New Braunfels
Cibolo, TX
Population 35,109
Converse, TX
Population 29,607
San Marcos, TX
Population 70,897
Live Oak, TX
Population 15,984
Schertz, TX
Population 44,050
Canyon Lake, TX
Population 33,883
Seguin, TX
Population 33,754
New Braunfels Demographics And Statistics
Population over time in New Braunfels
The current population in New Braunfels is 104,643. The population has increased 93.5% from 2010.
| Year | Population | % Change |
|---|---|---|
| 2024 | 104,643 | 6.0% |
| 2023 | 98,700 | 6.1% |
| 2022 | 92,993 | 6.2% |
| 2021 | 87,549 | 3.5% |
| 2020 | 84,622 | 6.5% |
| 2019 | 79,438 | 6.5% |
| 2018 | 74,587 | 6.1% |
| 2017 | 70,317 | 4.8% |
| 2016 | 67,097 | 4.7% |
| 2015 | 64,076 | 3.8% |
| 2014 | 61,712 | 3.5% |
| 2013 | 59,620 | 3.2% |
| 2012 | 57,776 | 3.0% |
| 2011 | 56,080 | 3.7% |
| 2010 | 54,072 | - |
Race / Ethnicity in New Braunfels
See the full breakdown
New Braunfels is:
59.9% White with 62,689 White residents.
2.0% African American with 2,080 African American residents.
0.1% American Indian with 53 American Indian residents.
1.1% Asian with 1,190 Asian residents.
0.0% Hawaiian with 0 Hawaiian residents.
0.3% Other with 308 Other residents.
3.0% Two Or More with 3,158 Two Or More residents.
33.6% Hispanic with 35,165 Hispanic residents.
| Race | New Braunfels | TX | USA |
|---|---|---|---|
| White | 59.9% | 39.1% | 57.4% |
| African American | 2.0% | 11.9% | 11.9% |
| American Indian | 0.1% | 0.1% | 0.5% |
| Asian | 1.1% | 5.5% | 5.9% |
| Hawaiian | 0.0% | 0.1% | 0.2% |
| Other | 0.3% | 0.4% | 0.6% |
| Two Or More | 3.0% | 3.1% | 4.3% |
| Hispanic | 33.6% | 39.7% | 19.3% |
Gender in New Braunfels
See the full breakdown
New Braunfels is 51.0% female with 53,347 female residents.
New Braunfels is 49.0% male with 51,295 male residents.
| Gender | New Braunfels | TX | USA |
|---|---|---|---|
| Female | 51.0% | 50.1% | 50.5% |
| Male | 49.0% | 49.9% | 49.5% |
Highest level of educational attainment in New Braunfels for adults over 25
See the full breakdown
4.0% of adults in New Braunfels completed < 9th grade.
4.0% of adults in New Braunfels completed 9-12th grade.
24.0% of adults in New Braunfels completed high school / ged.
23.0% of adults in New Braunfels completed some college.
7.0% of adults in New Braunfels completed associate's degree.
28.0% of adults in New Braunfels completed bachelor's degree.
8.0% of adults in New Braunfels completed master's degree.
1.0% of adults in New Braunfels completed professional degree.
1.0% of adults in New Braunfels completed doctorate degree.
| Education | New Braunfels | TX | USA |
|---|---|---|---|
| < 9th Grade | 4.0% | 8.0% | 4.0% |
| 9-12th Grade | 4.0% | 7.0% | 6.0% |
| High School / GED | 24.0% | 24.0% | 26.0% |
| Some College | 23.0% | 20.0% | 19.0% |
| Associate's Degree | 7.0% | 8.0% | 9.0% |
| Bachelor's Degree | 28.0% | 21.0% | 22.0% |
| Master's Degree | 8.0% | 9.0% | 10.0% |
| Professional Degree | 1.0% | 2.0% | 2.0% |
| Doctorate Degree | 1.0% | 1.0% | 2.0% |
Household Income For New Braunfels, Texas
See the full breakdown
3.6% of households in New Braunfels earn Less than $10,000.
2.1% of households in New Braunfels earn $10,000 to $14,999.
5.4% of households in New Braunfels earn $15,000 to $24,999.
5.1% of households in New Braunfels earn $25,000 to $34,999.
8.5% of households in New Braunfels earn $35,000 to $49,999.
17.4% of households in New Braunfels earn $50,000 to $74,999.
14.4% of households in New Braunfels earn $75,000 to $99,999.
21.2% of households in New Braunfels earn $100,000 to $149,999.
11.8% of households in New Braunfels earn $150,000 to $199,999.
10.5% of households in New Braunfels earn $200,000 or more.
| Income | New Braunfels | TX | USA |
|---|---|---|---|
| Less than $10,000 | 3.6% | 5.0% | 5.0% |
| $10,000 to $14,999 | 2.1% | 3.3% | 3.4% |
| $15,000 to $24,999 | 5.4% | 6.3% | 6.3% |
| $25,000 to $34,999 | 5.1% | 6.8% | 6.6% |
| $35,000 to $49,999 | 8.5% | 10.5% | 10.1% |
| $50,000 to $74,999 | 17.4% | 16.1% | 15.5% |
| $75,000 to $99,999 | 14.4% | 12.8% | 12.6% |
| $100,000 to $149,999 | 21.2% | 17.3% | 17.5% |
| $150,000 to $199,999 | 11.8% | 9.5% | 9.6% |
| $200,000 or more | 10.5% | 12.5% | 13.4% |
Source: U.S. Census ACS 5-year estimates (2024)


