Pearland, TX
Demographics And Statistics
Living In Pearland, Texas Summary
Life in Pearland research summary. HomeSnacks has been using Saturday Night Science to research the quality of life in Pearland over the past nine years using Census, FBI, Zillow, and other primary data sources. Based on the most recently available data, we found the following about life in Pearland:
The population in Pearland is 125,983.
The median home value in Pearland is $378,857.
The median income in Pearland is $112,470.
The cost of living in Pearland is 113 which is 1.1x higher than the national average.
The median rent in Pearland is $1,759.
The unemployment rate in Pearland is 3.1%.
The poverty rate in Pearland is 4.2%.
The average high in Pearland is 78.7° and the average low is 60.7°.
Pearland SnackAbility
Overall SnackAbility
Pearland, TX Crime Report
Crime in Pearland summary. We use data from the FBI to determine the crime rates in Pearland. Key points include:
There were 1,971 total crimes in Pearland in the last reporting year.
The overall crime rate per 100,000 people in Pearland is 1,536.0 / 100k people.
The violent crime rate per 100,000 people in Pearland is 95.9 / 100k people.
The property crime rate per 100,000 people in Pearland is 1,440.1 / 100k people.
Overall, crime in Pearland is -27.52% below the national average.
Total Crimes
Below National Average
Crime In Pearland Comparison Table
| Statistic | Count Raw |
Pearland / 100k People |
Texas / 100k People |
National / 100k People |
|---|---|---|---|---|
| Total Crimes Per 100K | 1,971 | 1,536.0 | 2,429.9 | 2,119.2 |
| Violent Crime | 123 | 95.9 | 389.4 | 359.0 |
| Murder | 3 | 2.3 | 5.2 | 5.0 |
| Robbery | 19 | 14.8 | 63.5 | 61.0 |
| Aggravated Assault | 70 | 54.6 | 270.7 | 256.0 |
| Property Crime | 1,848 | 1,440.1 | 2,040.5 | 1,760.0 |
| Burglary | 185 | 144.2 | 284.3 | 229.0 |
| Larceny | 1,547 | 1,205.6 | 1,425.6 | 1,272.0 |
| Car Theft | 116 | 90.4 | 330.7 | 259.0 |
Pearland, TX Cost Of Living
Cost of living in Pearland summary. We use data on the cost of living to determine how expensive it is to live in Pearland. Real estate prices drive most of the variance in cost of living around Texas. Key points include:
The cost of living in Pearland is 113 with 100 being average.
The cost of living in Pearland is 1.1x higher than the national average.
The median home value in Pearland is $378,857.
The median income in Pearland is $112,470.
Pearland's Overall Cost Of Living
Higher Than The National Average
Cost Of Living In Pearland Comparison Table
| Living Expense | Pearland | Texas | National Average | |
|---|---|---|---|---|
| Overall | 113 | 92 | 100 | |
| Services | 100 | 97 | 100 | |
| Groceries | 100 | 97 | 100 | |
| Health | 95 | 93 | 100 | |
| Housing | 146 | 82 | 100 | |
| Transportation | 92 | 94 | 100 | |
| Utilities | 101 | 104 | 100 | |
Pearland, TX Weather
The average high in Pearland is 78.7° and the average low is 60.7°.
There are 65.2 days of precipitation each year.
Expect an average of 53.2 inches of precipitation each year with 0.0 inches of snow.
| Stat | Pearland |
|---|---|
| Average Annual High | 78.7 |
| Average Annual Low | 60.7 |
| Annual Precipitation Days | 65.2 |
| Average Annual Precipitation | 53.2 |
| Average Annual Snowfall | 0.0 |
Average High
Days of Rain
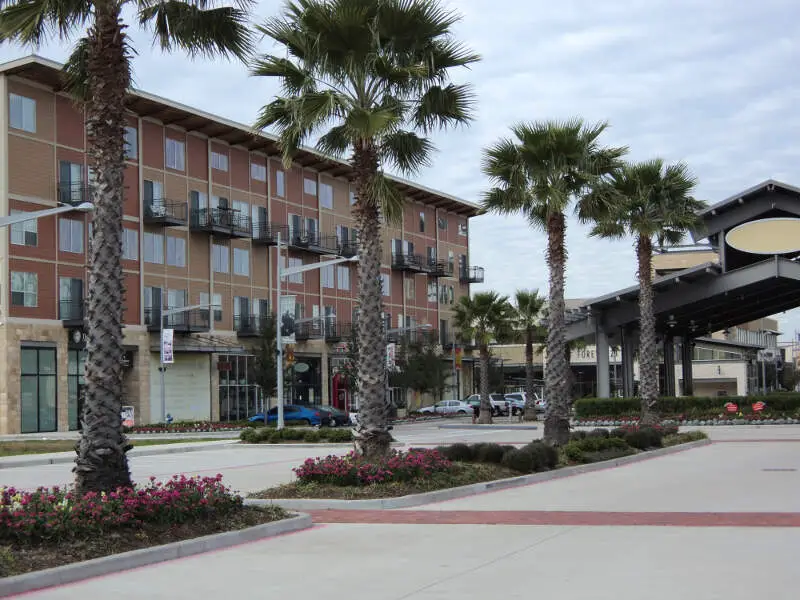
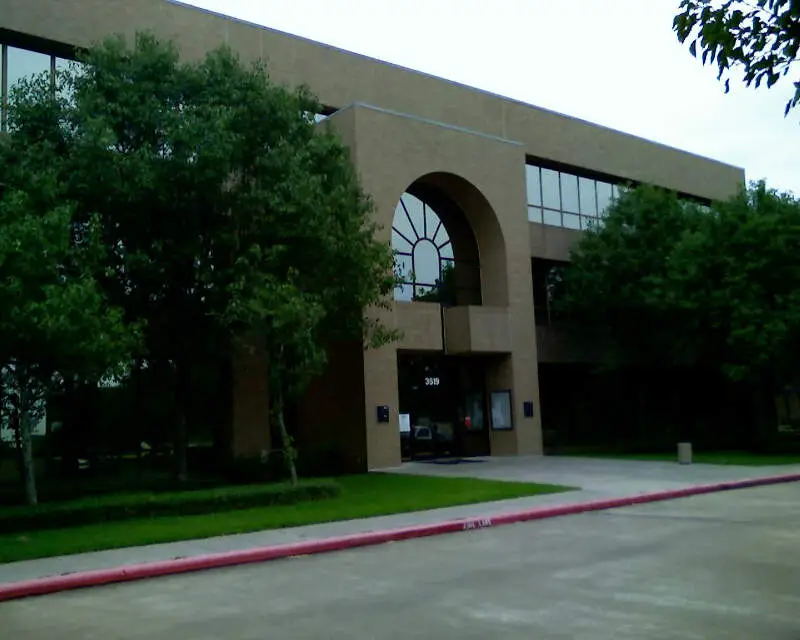
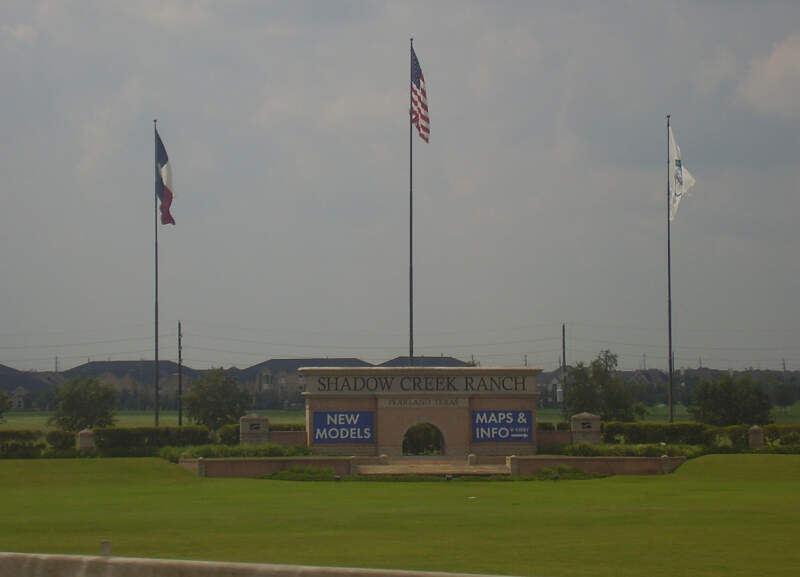
Pearland, TX Photos


Rankings for Pearland in Texas


Locations Around Pearland
Map Of Pearland, TX
Best Places Around Pearland
West University Place, TX
Population 14,907
Bellaire, TX
Population 17,116
Friendswood, TX
Population 40,827
Sugar Land, TX
Population 109,735
Deer Park, TX
Population 33,823
Fresno, TX
Population 24,087
Galena Park, TX
Population 10,527
Stafford, TX
Population 17,279
La Porte, TX
Population 36,077
Pearland Demographics And Statistics
Population over time in Pearland
The current population in Pearland is 125,983. The population has increased 52.2% from 2010.
| Year | Population | % Change |
|---|---|---|
| 2023 | 125,983 | 1.2% |
| 2022 | 124,478 | 1.5% |
| 2021 | 122,609 | -2.5% |
| 2020 | 125,817 | 3.1% |
| 2019 | 122,078 | 3.6% |
| 2018 | 117,867 | 3.7% |
| 2017 | 113,693 | 7.0% |
| 2016 | 106,238 | 4.4% |
| 2015 | 101,725 | 4.4% |
| 2014 | 97,427 | 3.5% |
| 2013 | 94,098 | 4.2% |
| 2012 | 90,347 | 3.9% |
| 2011 | 86,936 | 5.1% |
| 2010 | 82,748 | - |
Race / Ethnicity in Pearland
Pearland is:
36.8% White with 46,348 White residents.
17.9% African American with 22,585 African American residents.
0.2% American Indian with 205 American Indian residents.
16.9% Asian with 21,255 Asian residents.
0.0% Hawaiian with 30 Hawaiian residents.
0.3% Other with 325 Other residents.
2.5% Two Or More with 3,193 Two Or More residents.
25.4% Hispanic with 32,042 Hispanic residents.
| Race | Pearland | TX | USA |
|---|---|---|---|
| White | 36.8% | 39.9% | 58.2% |
| African American | 17.9% | 11.9% | 12.0% |
| American Indian | 0.2% | 0.2% | 0.5% |
| Asian | 16.9% | 5.3% | 5.7% |
| Hawaiian | 0.0% | 0.1% | 0.2% |
| Other | 0.3% | 0.4% | 0.5% |
| Two Or More | 2.5% | 2.9% | 3.9% |
| Hispanic | 25.4% | 39.5% | 19.0% |
Gender in Pearland
Pearland is 51.6% female with 64,966 female residents.
Pearland is 48.4% male with 61,016 male residents.
| Gender | Pearland | TX | USA |
|---|---|---|---|
| Female | 51.6% | 50.1% | 50.5% |
| Male | 48.4% | 49.9% | 49.5% |
Highest level of educational attainment in Pearland for adults over 25
3.0% of adults in Pearland completed < 9th grade.
2.0% of adults in Pearland completed 9-12th grade.
19.0% of adults in Pearland completed high school / ged.
20.0% of adults in Pearland completed some college.
9.0% of adults in Pearland completed associate's degree.
30.0% of adults in Pearland completed bachelor's degree.
11.0% of adults in Pearland completed master's degree.
3.0% of adults in Pearland completed professional degree.
3.0% of adults in Pearland completed doctorate degree.
| Education | Pearland | TX | USA |
|---|---|---|---|
| < 9th Grade | 3.0% | 7.0% | 5.0% |
| 9-12th Grade | 2.0% | 7.0% | 6.0% |
| High School / GED | 19.0% | 24.0% | 26.0% |
| Some College | 20.0% | 21.0% | 19.0% |
| Associate's Degree | 9.0% | 8.0% | 9.0% |
| Bachelor's Degree | 30.0% | 21.0% | 21.0% |
| Master's Degree | 11.0% | 9.0% | 10.0% |
| Professional Degree | 3.0% | 2.0% | 2.0% |
| Doctorate Degree | 3.0% | 1.0% | 2.0% |
Household Income For Pearland, Texas
1.8% of households in Pearland earn Less than $10,000.
1.1% of households in Pearland earn $10,000 to $14,999.
3.8% of households in Pearland earn $15,000 to $24,999.
3.2% of households in Pearland earn $25,000 to $34,999.
6.8% of households in Pearland earn $35,000 to $49,999.
13.4% of households in Pearland earn $50,000 to $74,999.
12.1% of households in Pearland earn $75,000 to $99,999.
21.7% of households in Pearland earn $100,000 to $149,999.
15.1% of households in Pearland earn $150,000 to $199,999.
21.0% of households in Pearland earn $200,000 or more.
| Income | Pearland | TX | USA |
|---|---|---|---|
| Less than $10,000 | 1.8% | 5.0% | 4.9% |
| $10,000 to $14,999 | 1.1% | 3.4% | 3.6% |
| $15,000 to $24,999 | 3.8% | 6.5% | 6.6% |
| $25,000 to $34,999 | 3.2% | 7.0% | 6.8% |
| $35,000 to $49,999 | 6.8% | 10.9% | 10.4% |
| $50,000 to $74,999 | 13.4% | 16.4% | 15.7% |
| $75,000 to $99,999 | 12.1% | 12.8% | 12.7% |
| $100,000 to $149,999 | 21.7% | 17.2% | 17.4% |
| $150,000 to $199,999 | 15.1% | 9.1% | 9.3% |
| $200,000 or more | 21.0% | 11.7% | 12.6% |


