Richmond SnackAbility
Overall SnackAbility
Crime in Richmond summary. We use data from the FBI to determine the crime rates in Richmond. Key points include:
There were 397 total crimes in Richmond in the last reporting year.
The overall crime rate per 100,000 people in Richmond is 2,989.7 / 100k people.
The violent crime rate per 100,000 people in Richmond is 248.5 / 100k people.
The property crime rate per 100,000 people in Richmond is 2,741.2 / 100k people.
Overall, crime in Richmond is 41.07% above the national average.
Total Crimes
Above National Average
Crime In Richmond Comparison Table
| Statistic | Count Raw |
Richmond / 100k People |
Texas / 100k People |
National / 100k People |
|---|---|---|---|---|
| Total Crimes Per 100K | 397 | 2,989.7 | 2,429.9 | 2,119.2 |
| Violent Crime | 33 | 248.5 | 389.4 | 359.0 |
| Murder | 0 | 0.0 | 5.2 | 5.0 |
| Robbery | 7 | 52.7 | 63.5 | 61.0 |
| Aggravated Assault | 19 | 143.1 | 270.7 | 256.0 |
| Property Crime | 364 | 2,741.2 | 2,040.5 | 1,760.0 |
| Burglary | 35 | 263.6 | 284.3 | 229.0 |
| Larceny | 320 | 2,409.8 | 1,425.6 | 1,272.0 |
| Car Theft | 9 | 67.8 | 330.7 | 259.0 |
Source: FBI Uniform Crime Reporting (2024)
Cost of living in Richmond summary. We use data on the cost of living to determine how expensive it is to live in Richmond. Real estate prices drive most of the variance in cost of living around Texas. Key points include:
The cost of living in Richmond is 97 with 100 being average.
The cost of living in Richmond is 1.0x lower than the national average.
The median home value in Richmond is $380,754.
The median income in Richmond is $50,337.
Richmond's Overall Cost Of Living
Lower Than The National Average
Cost Of Living In Richmond Comparison Table
| Living Expense | Richmond | Texas | National Average |
|---|---|---|---|
| Overall | 97 | 93 | 100 |
| Services | 98 | 100 | 100 |
| Groceries | 102 | 99 | 100 |
| Health | 96 | 81 | 100 |
| Housing | 99 | 97 | 100 |
| Transportation | 105 | 103 | 100 |
| Utilities | 98 | 100 | 100 |
Source: Cost of living index, normalized to US average = 100
Richmond, TX Weather
The average high in Richmond is 79.4° and the average low is 59.9°.
There are 62.0 days of precipitation each year.
Expect an average of 48.6 inches of precipitation each year with 0.0 inches of snow.
| Stat | Richmond |
|---|---|
| Average Annual High | 79.4 |
| Average Annual Low | 59.9 |
| Annual Precipitation Days | 62.0 |
| Average Annual Precipitation | 48.6 |
| Average Annual Snowfall | 0.0 |
Average High
Days of Rain
Source: NOAA climate normals (30-year)
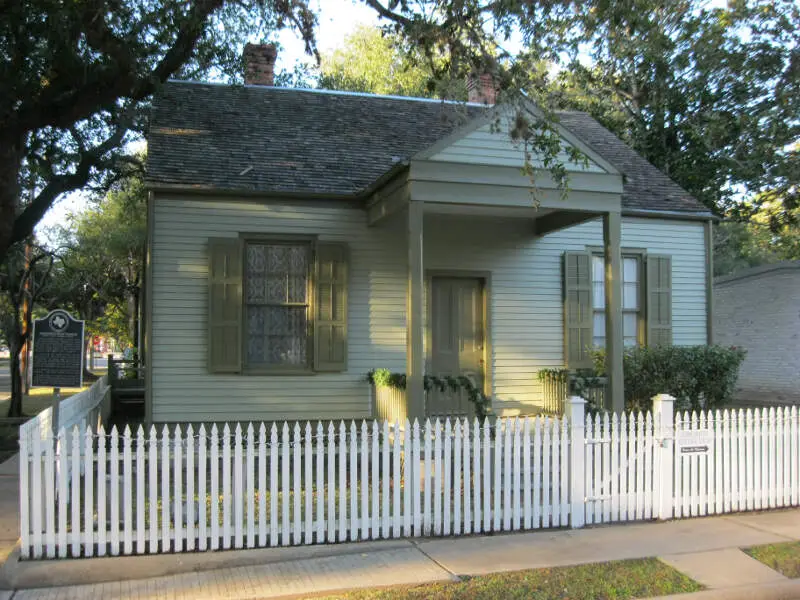
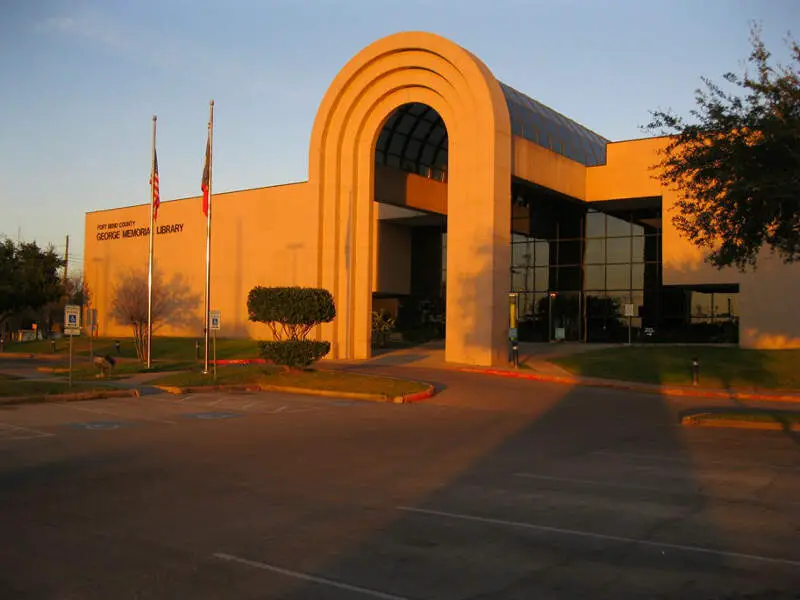
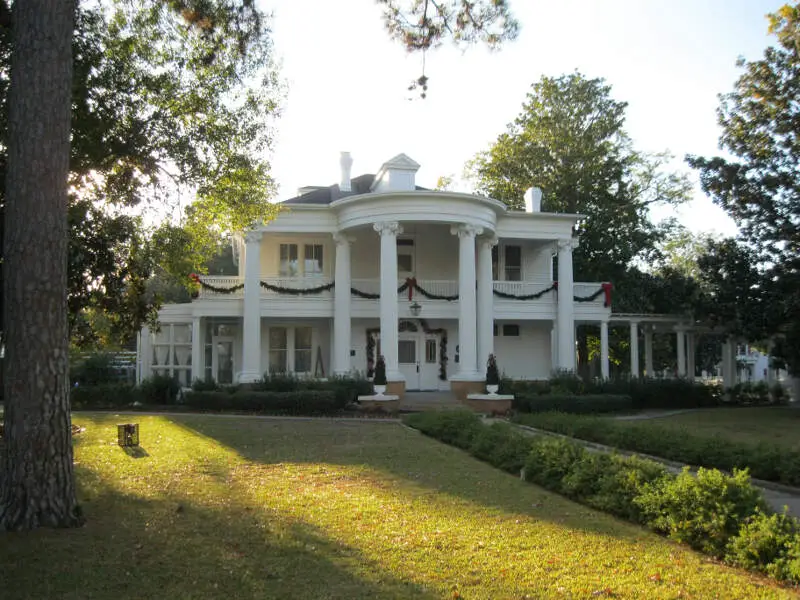
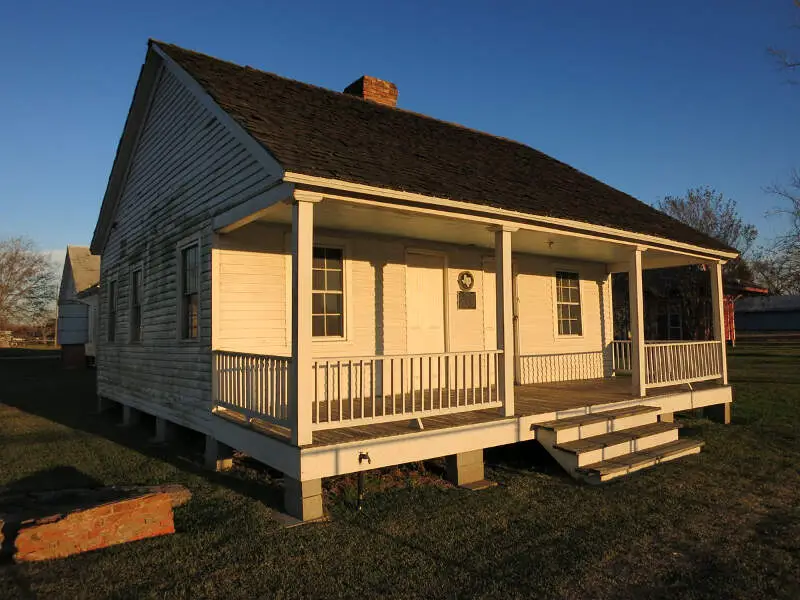
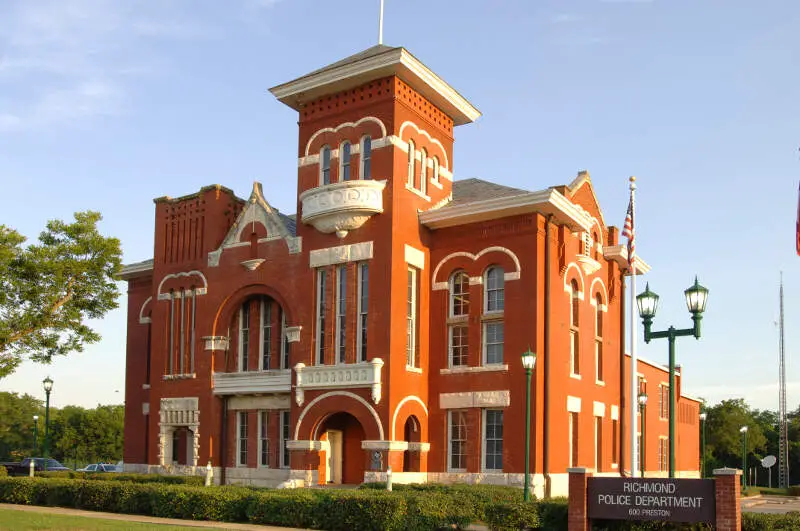
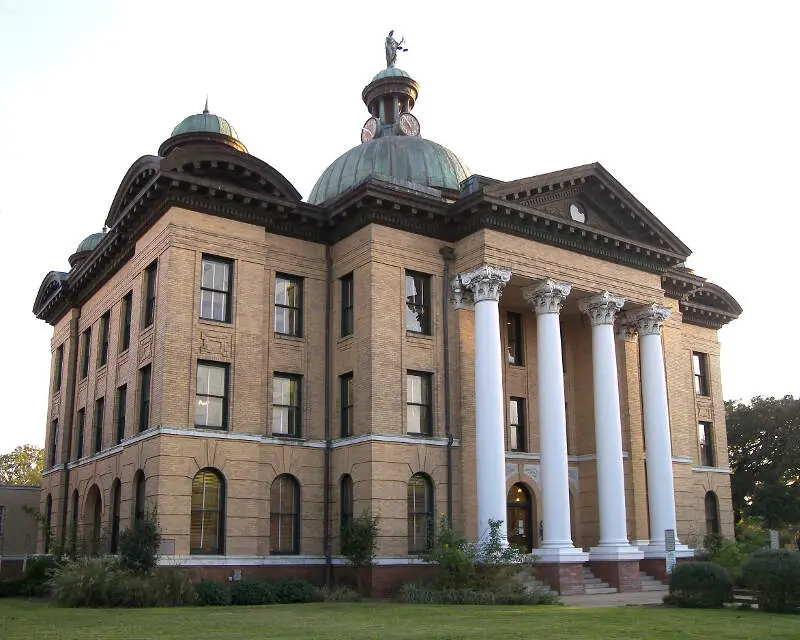
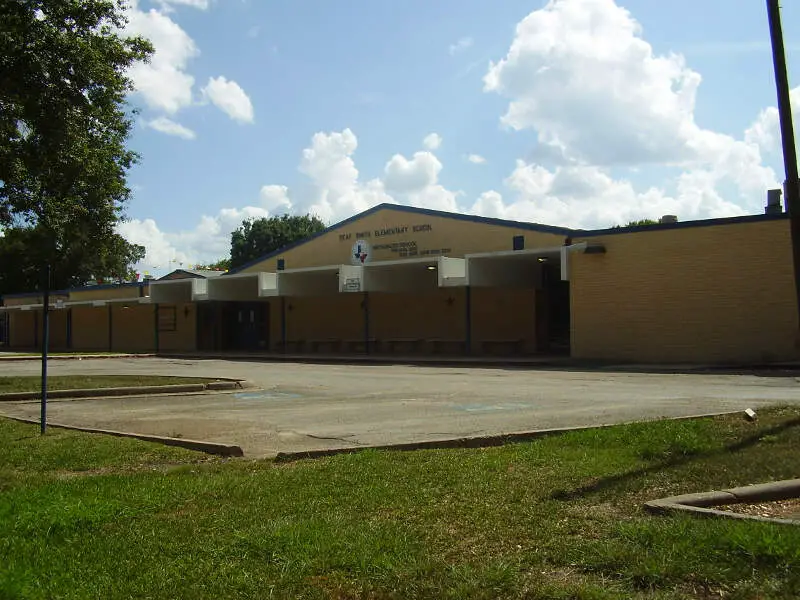
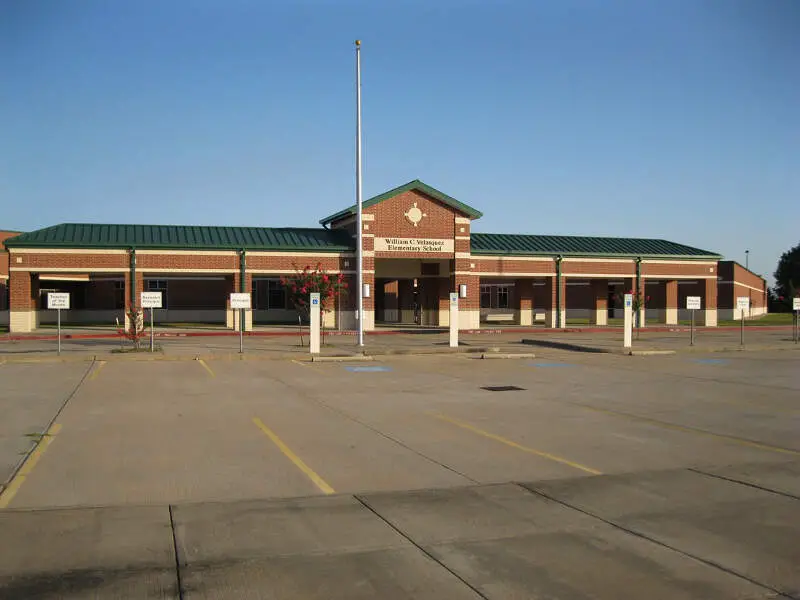
Richmond, TX Photos

Rankings & Articles For Richmond


Locations Around Richmond
Map Of Richmond, TX
Best Places Around Richmond
Four Corners, TX
Population 11,692
Bellaire, TX
Population 17,206
Cinco Ranch, TX
Population 18,611
Mission Bend, TX
Population 36,586
Sugar Land, TX
Population 110,016
Fresno, TX
Population 24,560
Pecan Grove, TX
Population 24,272
Richmond Demographics And Statistics
Population over time in Richmond
The current population in Richmond is 12,582. The population has increased 8.2% from 2010.
| Year | Population | % Change |
|---|---|---|
| 2024 | 12,582 | 3.8% |
| 2023 | 12,117 | 1.6% |
| 2022 | 11,931 | 1.4% |
| 2021 | 11,768 | -6.5% |
| 2020 | 12,592 | -0.4% |
| 2019 | 12,646 | 4.7% |
| 2018 | 12,084 | 0.2% |
| 2017 | 12,063 | 1.0% |
| 2016 | 11,939 | 0.4% |
| 2015 | 11,895 | 1.1% |
| 2014 | 11,769 | 0.4% |
| 2013 | 11,724 | 0.2% |
| 2012 | 11,703 | -0.3% |
| 2011 | 11,736 | 0.9% |
| 2010 | 11,629 | - |
Race / Ethnicity in Richmond
See the full breakdown
Richmond is:
22.9% White with 2,886 White residents.
22.1% African American with 2,786 African American residents.
0.0% American Indian with 6 American Indian residents.
4.6% Asian with 577 Asian residents.
0.0% Hawaiian with 0 Hawaiian residents.
0.2% Other with 30 Other residents.
1.1% Two Or More with 137 Two Or More residents.
49.0% Hispanic with 6,160 Hispanic residents.
| Race | Richmond | TX | USA |
|---|---|---|---|
| White | 22.9% | 39.1% | 57.4% |
| African American | 22.1% | 11.9% | 11.9% |
| American Indian | 0.0% | 0.1% | 0.5% |
| Asian | 4.6% | 5.5% | 5.9% |
| Hawaiian | 0.0% | 0.1% | 0.2% |
| Other | 0.2% | 0.4% | 0.6% |
| Two Or More | 1.1% | 3.1% | 4.3% |
| Hispanic | 49.0% | 39.7% | 19.3% |
Gender in Richmond
See the full breakdown
Richmond is 47.1% female with 5,926 female residents.
Richmond is 52.9% male with 6,656 male residents.
| Gender | Richmond | TX | USA |
|---|---|---|---|
| Female | 47.1% | 50.1% | 50.5% |
| Male | 52.9% | 49.9% | 49.5% |
Highest level of educational attainment in Richmond for adults over 25
See the full breakdown
14.0% of adults in Richmond completed < 9th grade.
10.0% of adults in Richmond completed 9-12th grade.
25.0% of adults in Richmond completed high school / ged.
26.0% of adults in Richmond completed some college.
6.0% of adults in Richmond completed associate's degree.
10.0% of adults in Richmond completed bachelor's degree.
6.0% of adults in Richmond completed master's degree.
1.0% of adults in Richmond completed professional degree.
2.0% of adults in Richmond completed doctorate degree.
| Education | Richmond | TX | USA |
|---|---|---|---|
| < 9th Grade | 14.0% | 8.0% | 4.0% |
| 9-12th Grade | 10.0% | 7.0% | 6.0% |
| High School / GED | 25.0% | 24.0% | 26.0% |
| Some College | 26.0% | 20.0% | 19.0% |
| Associate's Degree | 6.0% | 8.0% | 9.0% |
| Bachelor's Degree | 10.0% | 21.0% | 22.0% |
| Master's Degree | 6.0% | 9.0% | 10.0% |
| Professional Degree | 1.0% | 2.0% | 2.0% |
| Doctorate Degree | 2.0% | 1.0% | 2.0% |
Household Income For Richmond, Texas
See the full breakdown
4.6% of households in Richmond earn Less than $10,000.
7.5% of households in Richmond earn $10,000 to $14,999.
9.3% of households in Richmond earn $15,000 to $24,999.
13.9% of households in Richmond earn $25,000 to $34,999.
14.4% of households in Richmond earn $35,000 to $49,999.
16.8% of households in Richmond earn $50,000 to $74,999.
12.0% of households in Richmond earn $75,000 to $99,999.
13.9% of households in Richmond earn $100,000 to $149,999.
2.3% of households in Richmond earn $150,000 to $199,999.
5.2% of households in Richmond earn $200,000 or more.
| Income | Richmond | TX | USA |
|---|---|---|---|
| Less than $10,000 | 4.6% | 5.0% | 5.0% |
| $10,000 to $14,999 | 7.5% | 3.3% | 3.4% |
| $15,000 to $24,999 | 9.3% | 6.3% | 6.3% |
| $25,000 to $34,999 | 13.9% | 6.8% | 6.6% |
| $35,000 to $49,999 | 14.4% | 10.5% | 10.1% |
| $50,000 to $74,999 | 16.8% | 16.1% | 15.5% |
| $75,000 to $99,999 | 12.0% | 12.8% | 12.6% |
| $100,000 to $149,999 | 13.9% | 17.3% | 17.5% |
| $150,000 to $199,999 | 2.3% | 9.5% | 9.6% |
| $200,000 or more | 5.2% | 12.5% | 13.4% |
Source: U.S. Census ACS 5-year estimates (2024)


