Round Rock SnackAbility
Overall SnackAbility
Crime in Round Rock summary. We use data from the FBI to determine the crime rates in Round Rock. Key points include:
There were 2,773 total crimes in Round Rock in the last reporting year.
The overall crime rate per 100,000 people in Round Rock is 2,071.4 / 100k people.
The violent crime rate per 100,000 people in Round Rock is 130.7 / 100k people.
The property crime rate per 100,000 people in Round Rock is 1,940.7 / 100k people.
Overall, crime in Round Rock is -2.26% below the national average.
Total Crimes
Below National Average
Crime In Round Rock Comparison Table
| Statistic | Count Raw |
Round Rock / 100k People |
Texas / 100k People |
National / 100k People |
|---|---|---|---|---|
| Total Crimes Per 100K | 2,773 | 2,071.4 | 2,429.9 | 2,119.2 |
| Violent Crime | 175 | 130.7 | 389.4 | 359.0 |
| Murder | 2 | 1.5 | 5.2 | 5.0 |
| Robbery | 23 | 17.2 | 63.5 | 61.0 |
| Aggravated Assault | 111 | 82.9 | 270.7 | 256.0 |
| Property Crime | 2,598 | 1,940.7 | 2,040.5 | 1,760.0 |
| Burglary | 228 | 170.3 | 284.3 | 229.0 |
| Larceny | 2,181 | 1,629.2 | 1,425.6 | 1,272.0 |
| Car Theft | 189 | 141.2 | 330.7 | 259.0 |
Source: FBI Uniform Crime Reporting (2024)
Cost of living in Round Rock summary. We use data on the cost of living to determine how expensive it is to live in Round Rock. Real estate prices drive most of the variance in cost of living around Texas. Key points include:
The cost of living in Round Rock is 111 with 100 being average.
The cost of living in Round Rock is 1.1x higher than the national average.
The median home value in Round Rock is $407,077.
The median income in Round Rock is $99,287.
Round Rock's Overall Cost Of Living
Higher Than The National Average
Cost Of Living In Round Rock Comparison Table
| Living Expense | Round Rock | Texas | National Average |
|---|---|---|---|
| Overall | 111 | 93 | 100 |
| Services | 97 | 100 | 100 |
| Groceries | 95 | 99 | 100 |
| Health | 142 | 81 | 100 |
| Housing | 94 | 97 | 100 |
| Transportation | 104 | 103 | 100 |
| Utilities | 97 | 100 | 100 |
Source: Cost of living index, normalized to US average = 100
Round Rock, TX Weather
The average high in Round Rock is 79.1° and the average low is 56.1°.
There are 50.3 days of precipitation each year.
Expect an average of 35.1 inches of precipitation each year with 0.1 inches of snow.
| Stat | Round Rock |
|---|---|
| Average Annual High | 79.1 |
| Average Annual Low | 56.1 |
| Annual Precipitation Days | 50.3 |
| Average Annual Precipitation | 35.1 |
| Average Annual Snowfall | 0.1 |
Average High
Days of Rain
Source: NOAA climate normals (30-year)
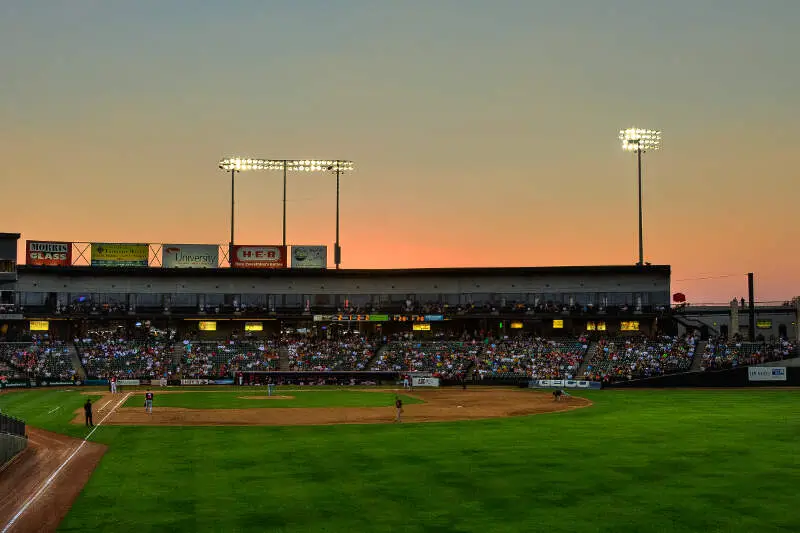
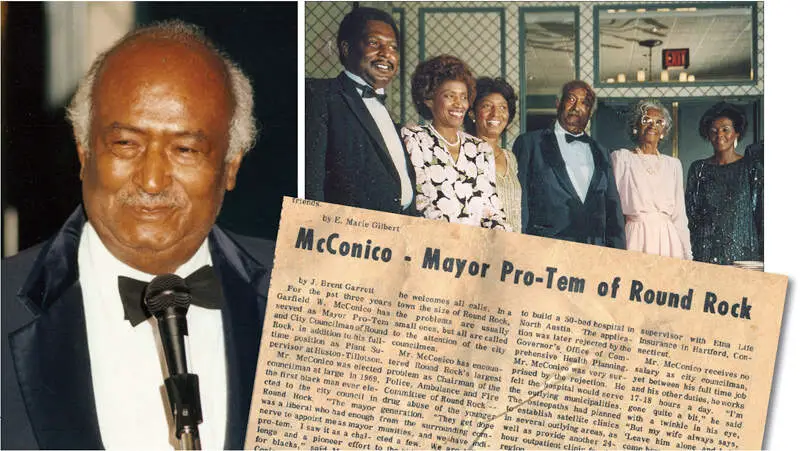
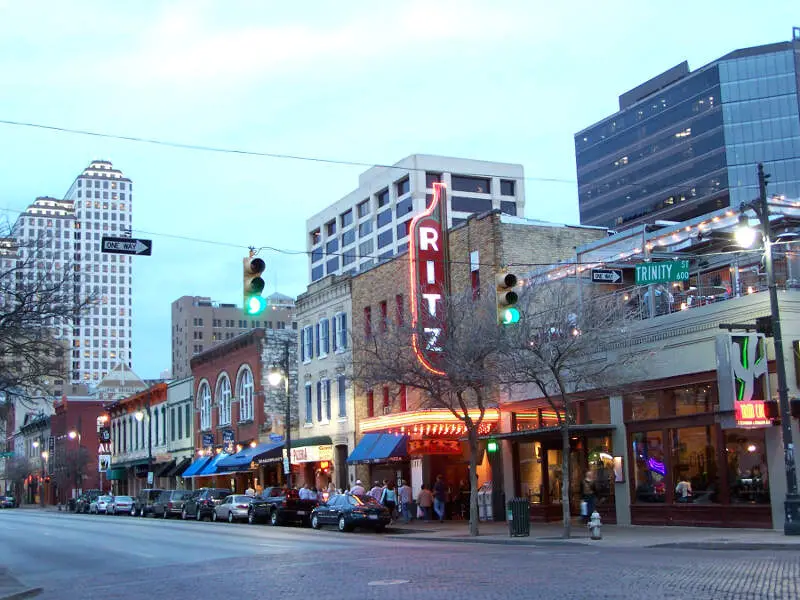
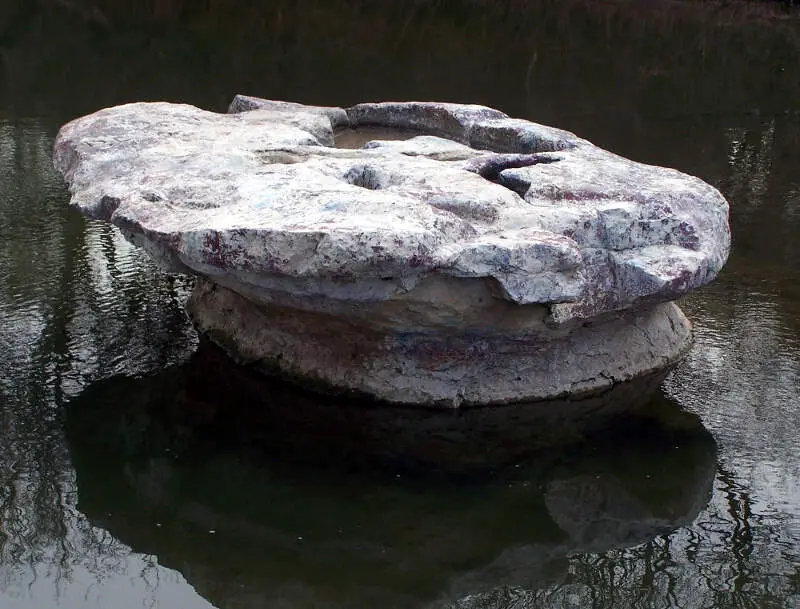
Round Rock, TX Photos
1 Reviews & Comments About Round Rock

I love Round Rock. There is so much to do for families here from free events, our local library, beautiful parks and convenient shopping. We love the friendliness of the majority of people here as well.
The parks are absolutely wonderful for kids. There are ample playgrounds that were designed above and beyond a normal playscape.
Rankings & Articles For Round Rock


Locations Around Round Rock
Map Of Round Rock, TX
Best Places Around Round Rock
Brushy Creek, TX
Population 19,576
Cedar Park, TX
Population 78,301
Pflugerville, TX
Population 65,971
Hutto, TX
Population 35,483
Leander, TX
Population 74,067
Georgetown, TX
Population 85,999
Austin, TX
Population 979,539
Wells Branch, TX
Population 13,523
Taylor, TX
Population 17,136
Round Rock Demographics And Statistics
Population over time in Round Rock
The current population in Round Rock is 127,786. The population has increased 37.3% from 2010.
| Year | Population | % Change |
|---|---|---|
| 2024 | 127,786 | 2.8% |
| 2023 | 124,288 | 3.2% |
| 2022 | 120,465 | 2.3% |
| 2021 | 117,735 | -8.6% |
| 2020 | 128,812 | 3.5% |
| 2019 | 124,434 | 3.6% |
| 2018 | 120,157 | 3.3% |
| 2017 | 116,369 | 3.2% |
| 2016 | 112,767 | 2.8% |
| 2015 | 109,690 | 2.5% |
| 2014 | 106,972 | 2.8% |
| 2013 | 104,070 | 3.3% |
| 2012 | 100,764 | 3.4% |
| 2011 | 97,432 | 4.7% |
| 2010 | 93,092 | - |
Race / Ethnicity in Round Rock
See the full breakdown
Round Rock is:
45.9% White with 58,640 White residents.
11.0% African American with 14,016 African American residents.
0.1% American Indian with 135 American Indian residents.
8.1% Asian with 10,335 Asian residents.
0.2% Hawaiian with 298 Hawaiian residents.
0.8% Other with 1,072 Other residents.
4.2% Two Or More with 5,383 Two Or More residents.
29.7% Hispanic with 37,907 Hispanic residents.
| Race | Round Rock | TX | USA |
|---|---|---|---|
| White | 45.9% | 39.1% | 57.4% |
| African American | 11.0% | 11.9% | 11.9% |
| American Indian | 0.1% | 0.1% | 0.5% |
| Asian | 8.1% | 5.5% | 5.9% |
| Hawaiian | 0.2% | 0.1% | 0.2% |
| Other | 0.8% | 0.4% | 0.6% |
| Two Or More | 4.2% | 3.1% | 4.3% |
| Hispanic | 29.7% | 39.7% | 19.3% |
Gender in Round Rock
See the full breakdown
Round Rock is 50.6% female with 64,619 female residents.
Round Rock is 49.4% male with 63,167 male residents.
| Gender | Round Rock | TX | USA |
|---|---|---|---|
| Female | 50.6% | 50.1% | 50.5% |
| Male | 49.4% | 49.9% | 49.5% |
Highest level of educational attainment in Round Rock for adults over 25
See the full breakdown
3.0% of adults in Round Rock completed < 9th grade.
3.0% of adults in Round Rock completed 9-12th grade.
19.0% of adults in Round Rock completed high school / ged.
21.0% of adults in Round Rock completed some college.
9.0% of adults in Round Rock completed associate's degree.
28.0% of adults in Round Rock completed bachelor's degree.
14.0% of adults in Round Rock completed master's degree.
1.0% of adults in Round Rock completed professional degree.
2.0% of adults in Round Rock completed doctorate degree.
| Education | Round Rock | TX | USA |
|---|---|---|---|
| < 9th Grade | 3.0% | 8.0% | 4.0% |
| 9-12th Grade | 3.0% | 7.0% | 6.0% |
| High School / GED | 19.0% | 24.0% | 26.0% |
| Some College | 21.0% | 20.0% | 19.0% |
| Associate's Degree | 9.0% | 8.0% | 9.0% |
| Bachelor's Degree | 28.0% | 21.0% | 22.0% |
| Master's Degree | 14.0% | 9.0% | 10.0% |
| Professional Degree | 1.0% | 2.0% | 2.0% |
| Doctorate Degree | 2.0% | 1.0% | 2.0% |
Household Income For Round Rock, Texas
See the full breakdown
3.8% of households in Round Rock earn Less than $10,000.
1.5% of households in Round Rock earn $10,000 to $14,999.
2.9% of households in Round Rock earn $15,000 to $24,999.
5.2% of households in Round Rock earn $25,000 to $34,999.
8.1% of households in Round Rock earn $35,000 to $49,999.
15.9% of households in Round Rock earn $50,000 to $74,999.
13.0% of households in Round Rock earn $75,000 to $99,999.
19.8% of households in Round Rock earn $100,000 to $149,999.
12.5% of households in Round Rock earn $150,000 to $199,999.
17.4% of households in Round Rock earn $200,000 or more.
| Income | Round Rock | TX | USA |
|---|---|---|---|
| Less than $10,000 | 3.8% | 5.0% | 5.0% |
| $10,000 to $14,999 | 1.5% | 3.3% | 3.4% |
| $15,000 to $24,999 | 2.9% | 6.3% | 6.3% |
| $25,000 to $34,999 | 5.2% | 6.8% | 6.6% |
| $35,000 to $49,999 | 8.1% | 10.5% | 10.1% |
| $50,000 to $74,999 | 15.9% | 16.1% | 15.5% |
| $75,000 to $99,999 | 13.0% | 12.8% | 12.6% |
| $100,000 to $149,999 | 19.8% | 17.3% | 17.5% |
| $150,000 to $199,999 | 12.5% | 9.5% | 9.6% |
| $200,000 or more | 17.4% | 12.5% | 13.4% |
Source: U.S. Census ACS 5-year estimates (2024)


