San Juan SnackAbility
Overall SnackAbility
Crime in San Juan summary. We use data from the FBI to determine the crime rates in San Juan. Key points include:
There were 579 total crimes in San Juan in the last reporting year.
The overall crime rate per 100,000 people in San Juan is 1,572.6 / 100k people.
The violent crime rate per 100,000 people in San Juan is 154.8 / 100k people.
The property crime rate per 100,000 people in San Juan is 1,417.7 / 100k people.
Overall, crime in San Juan is -25.80% below the national average.
Total Crimes
Below National Average
Crime In San Juan Comparison Table
| Statistic | Count Raw |
San Juan / 100k People |
Texas / 100k People |
National / 100k People |
|---|---|---|---|---|
| Total Crimes Per 100K | 579 | 1,572.6 | 2,429.9 | 2,119.2 |
| Violent Crime | 57 | 154.8 | 389.4 | 359.0 |
| Murder | 3 | 8.1 | 5.2 | 5.0 |
| Robbery | 11 | 29.9 | 63.5 | 61.0 |
| Aggravated Assault | 43 | 116.8 | 270.7 | 256.0 |
| Property Crime | 522 | 1,417.7 | 2,040.5 | 1,760.0 |
| Burglary | 84 | 228.1 | 284.3 | 229.0 |
| Larceny | 408 | 1,108.1 | 1,425.6 | 1,272.0 |
| Car Theft | 30 | 81.5 | 330.7 | 259.0 |
Source: FBI Uniform Crime Reporting (2024)
Cost of living in San Juan summary. We use data on the cost of living to determine how expensive it is to live in San Juan. Real estate prices drive most of the variance in cost of living around Texas. Key points include:
The cost of living in San Juan is 85 with 100 being average.
The cost of living in San Juan is 0.8x lower than the national average.
The median home value in San Juan is $182,709.
The median income in San Juan is $56,562.
San Juan's Overall Cost Of Living
Lower Than The National Average
Cost Of Living In San Juan Comparison Table
| Living Expense | San Juan | Texas | National Average |
|---|---|---|---|
| Overall | 85 | 93 | 100 |
| Services | 96 | 100 | 100 |
| Groceries | 99 | 99 | 100 |
| Health | 60 | 81 | 100 |
| Housing | 97 | 97 | 100 |
| Transportation | 106 | 103 | 100 |
| Utilities | 96 | 100 | 100 |
Source: Cost of living index, normalized to US average = 100
San Juan, TX Weather
The average high in San Juan is 85.2° and the average low is 63.8°.
There are 31.1 days of precipitation each year.
Expect an average of 21.7 inches of precipitation each year with 0.0 inches of snow.
| Stat | San Juan |
|---|---|
| Average Annual High | 85.2 |
| Average Annual Low | 63.8 |
| Annual Precipitation Days | 31.1 |
| Average Annual Precipitation | 21.7 |
| Average Annual Snowfall | 0.0 |
Average High
Days of Rain
Source: NOAA climate normals (30-year)
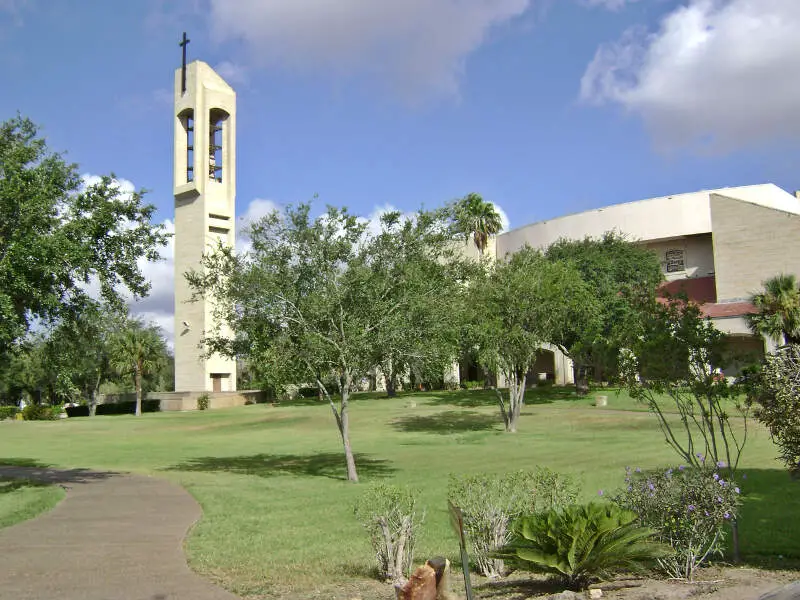
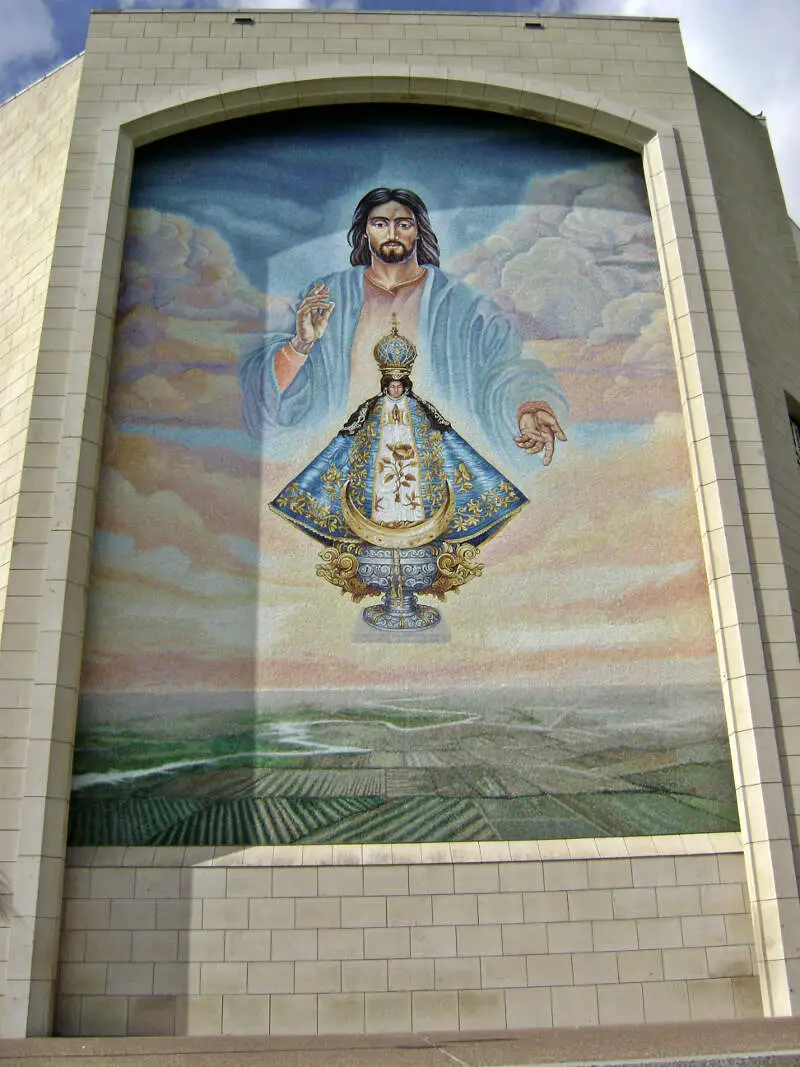
San Juan, TX Photos
Rankings & Articles For San Juan


Locations Around San Juan
Map Of San Juan, TX
Best Places Around San Juan
Hidalgo, TX
Population 14,498
McAllen, TX
Population 145,385
Edinburg, TX
Population 104,550
La Homa, TX
Population 11,285
Alton, TX
Population 20,214
Pharr, TX
Population 80,333
Mission, TX
Population 87,038
Alamo, TX
Population 20,255
Weslaco, TX
Population 42,229
Mercedes, TX
Population 16,733
San Juan Demographics And Statistics
Population over time in San Juan
The current population in San Juan is 36,149. The population has increased 11.1% from 2010.
| Year | Population | % Change |
|---|---|---|
| 2024 | 36,149 | 1.3% |
| 2023 | 35,674 | 0.6% |
| 2022 | 35,463 | 0.2% |
| 2021 | 35,384 | -3.7% |
| 2020 | 36,759 | 0.0% |
| 2019 | 36,744 | 0.0% |
| 2018 | 36,740 | 0.7% |
| 2017 | 36,469 | 1.4% |
| 2016 | 35,983 | 0.8% |
| 2015 | 35,692 | 1.4% |
| 2014 | 35,183 | 1.8% |
| 2013 | 34,556 | 1.9% |
| 2012 | 33,927 | 1.9% |
| 2011 | 33,284 | 2.3% |
| 2010 | 32,543 | - |
Race / Ethnicity in San Juan
See the full breakdown
San Juan is:
2.9% White with 1,060 White residents.
0.0% African American with 0 African American residents.
0.0% American Indian with 17 American Indian residents.
0.2% Asian with 55 Asian residents.
0.0% Hawaiian with 14 Hawaiian residents.
0.0% Other with 15 Other residents.
0.3% Two Or More with 102 Two Or More residents.
96.5% Hispanic with 34,886 Hispanic residents.
| Race | San Juan | TX | USA |
|---|---|---|---|
| White | 2.9% | 39.1% | 57.4% |
| African American | 0.0% | 11.9% | 11.9% |
| American Indian | 0.0% | 0.1% | 0.5% |
| Asian | 0.2% | 5.5% | 5.9% |
| Hawaiian | 0.0% | 0.1% | 0.2% |
| Other | 0.0% | 0.4% | 0.6% |
| Two Or More | 0.3% | 3.1% | 4.3% |
| Hispanic | 96.5% | 39.7% | 19.3% |
Gender in San Juan
See the full breakdown
San Juan is 48.5% female with 17,526 female residents.
San Juan is 51.5% male with 18,622 male residents.
| Gender | San Juan | TX | USA |
|---|---|---|---|
| Female | 48.5% | 50.1% | 50.5% |
| Male | 51.5% | 49.9% | 49.5% |
Highest level of educational attainment in San Juan for adults over 25
See the full breakdown
18.0% of adults in San Juan completed < 9th grade.
18.0% of adults in San Juan completed 9-12th grade.
26.0% of adults in San Juan completed high school / ged.
17.0% of adults in San Juan completed some college.
6.0% of adults in San Juan completed associate's degree.
11.0% of adults in San Juan completed bachelor's degree.
4.0% of adults in San Juan completed master's degree.
0.0% of adults in San Juan completed professional degree.
0.0% of adults in San Juan completed doctorate degree.
| Education | San Juan | TX | USA |
|---|---|---|---|
| < 9th Grade | 18.0% | 8.0% | 4.0% |
| 9-12th Grade | 18.0% | 7.0% | 6.0% |
| High School / GED | 26.0% | 24.0% | 26.0% |
| Some College | 17.0% | 20.0% | 19.0% |
| Associate's Degree | 6.0% | 8.0% | 9.0% |
| Bachelor's Degree | 11.0% | 21.0% | 22.0% |
| Master's Degree | 4.0% | 9.0% | 10.0% |
| Professional Degree | 0.0% | 2.0% | 2.0% |
| Doctorate Degree | 0.0% | 1.0% | 2.0% |
Household Income For San Juan, Texas
See the full breakdown
5.0% of households in San Juan earn Less than $10,000.
3.7% of households in San Juan earn $10,000 to $14,999.
10.4% of households in San Juan earn $15,000 to $24,999.
9.8% of households in San Juan earn $25,000 to $34,999.
15.0% of households in San Juan earn $35,000 to $49,999.
20.7% of households in San Juan earn $50,000 to $74,999.
17.5% of households in San Juan earn $75,000 to $99,999.
10.9% of households in San Juan earn $100,000 to $149,999.
5.0% of households in San Juan earn $150,000 to $199,999.
2.0% of households in San Juan earn $200,000 or more.
| Income | San Juan | TX | USA |
|---|---|---|---|
| Less than $10,000 | 5.0% | 5.0% | 5.0% |
| $10,000 to $14,999 | 3.7% | 3.3% | 3.4% |
| $15,000 to $24,999 | 10.4% | 6.3% | 6.3% |
| $25,000 to $34,999 | 9.8% | 6.8% | 6.6% |
| $35,000 to $49,999 | 15.0% | 10.5% | 10.1% |
| $50,000 to $74,999 | 20.7% | 16.1% | 15.5% |
| $75,000 to $99,999 | 17.5% | 12.8% | 12.6% |
| $100,000 to $149,999 | 10.9% | 17.3% | 17.5% |
| $150,000 to $199,999 | 5.0% | 9.5% | 9.6% |
| $200,000 or more | 2.0% | 12.5% | 13.4% |
Source: U.S. Census ACS 5-year estimates (2024)


