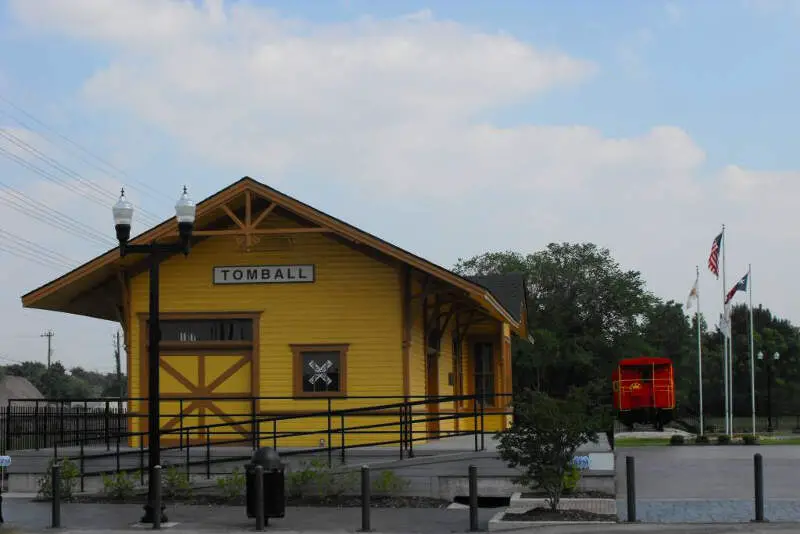
Tomball, TX
Demographics And Statistics
Living In Tomball, Texas Summary
Life in Tomball research summary. HomeSnacks has been using Saturday Night Science to research the quality of life in Tomball over the past nine years using Census, FBI, Zillow, and other primary data sources. Based on the most recently available data, we found the following about life in Tomball:
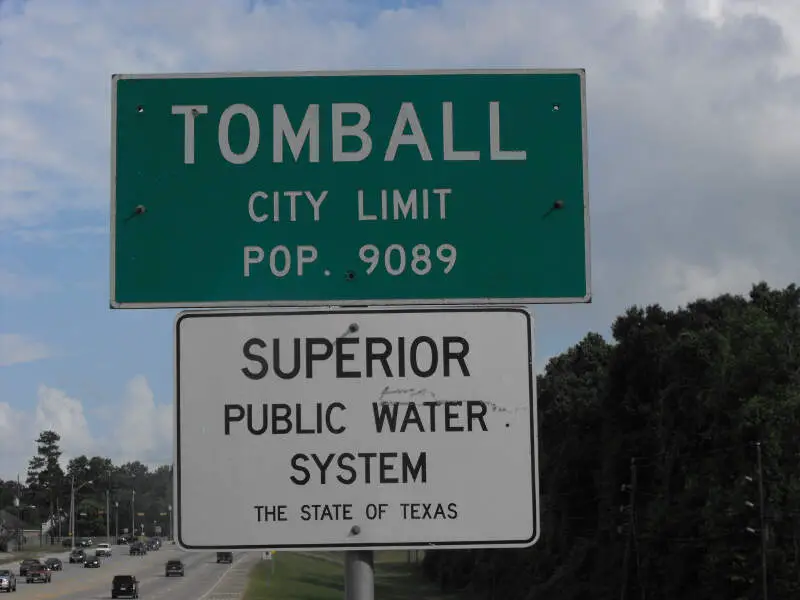
The population in Tomball is 13,032.
The median home value in Tomball is $359,219.
The median income in Tomball is $71,426.
The cost of living in Tomball is 101 which is 1.0x higher than the national average.
The median rent in Tomball is $1,206.
The unemployment rate in Tomball is 3.6%.
The poverty rate in Tomball is 9.9%.
The average high in Tomball is 78.7° and the average low is 58.9°.
Tomball SnackAbility
Overall SnackAbility
Tomball, TX Crime Report
Crime in Tomball summary. We use data from the FBI to determine the crime rates in Tomball. Key points include:
There were 333 total crimes in Tomball in the last reporting year.
The overall crime rate per 100,000 people in Tomball is 2,237.2 / 100k people.
The violent crime rate per 100,000 people in Tomball is 268.7 / 100k people.
The property crime rate per 100,000 people in Tomball is 1,968.4 / 100k people.
Overall, crime in Tomball is 5.56% above the national average.
Total Crimes
Above National Average
Crime In Tomball Comparison Table
| Statistic | Count Raw |
Tomball / 100k People |
Texas / 100k People |
National / 100k People |
|---|---|---|---|---|
| Total Crimes Per 100K | 333 | 2,237.2 | 2,429.9 | 2,119.2 |
| Violent Crime | 40 | 268.7 | 389.4 | 359.0 |
| Murder | 1 | 6.7 | 5.2 | 5.0 |
| Robbery | 2 | 13.4 | 63.5 | 61.0 |
| Aggravated Assault | 30 | 201.5 | 270.7 | 256.0 |
| Property Crime | 293 | 1,968.4 | 2,040.5 | 1,760.0 |
| Burglary | 21 | 141.1 | 284.3 | 229.0 |
| Larceny | 236 | 1,585.5 | 1,425.6 | 1,272.0 |
| Car Theft | 36 | 241.9 | 330.7 | 259.0 |
Tomball, TX Cost Of Living
Cost of living in Tomball summary. We use data on the cost of living to determine how expensive it is to live in Tomball. Real estate prices drive most of the variance in cost of living around Texas. Key points include:
The cost of living in Tomball is 101 with 100 being average.
The cost of living in Tomball is 1.0x higher than the national average.
The median home value in Tomball is $359,219.
The median income in Tomball is $71,426.
Tomball's Overall Cost Of Living
Higher Than The National Average
Cost Of Living In Tomball Comparison Table
| Living Expense | Tomball | Texas | National Average | |
|---|---|---|---|---|
| Overall | 101 | 92 | 100 | |
| Services | 94 | 97 | 100 | |
| Groceries | 97 | 97 | 100 | |
| Health | 99 | 93 | 100 | |
| Housing | 110 | 82 | 100 | |
| Transportation | 86 | 94 | 100 | |
| Utilities | 105 | 104 | 100 | |
Tomball, TX Weather
The average high in Tomball is 78.7° and the average low is 58.9°.
There are 63.0 days of precipitation each year.
Expect an average of 47.7 inches of precipitation each year with 0.0 inches of snow.
| Stat | Tomball |
|---|---|
| Average Annual High | 78.7 |
| Average Annual Low | 58.9 |
| Annual Precipitation Days | 63.0 |
| Average Annual Precipitation | 47.7 |
| Average Annual Snowfall | 0.0 |
Average High
Days of Rain
Tomball, TX Photos
10 Reviews & Comments About Tomball
/5

Pea Pie 2000 - None
I live in Tomball. We don't have much crime here. It's a lot less populated than most Houston suburbs. We can actually drive on our roads as opposed to Spring or Cypress that are nearby. The price of living here is average. We are right next to the Woodlands, which is super nice and not crowded at all. Everything is well kept and easy on the eyes. It's nice having easy access to such an upscale area but for and average price tag. I wouldn't live anywhere else in the Houston area. Most of the other suburbs are super high in crime and so crowded that you can't even go to your neighborhood store without dealing with tons of traffic and long lines. Do better research next time. P.S. our THS superintendent has a PHD. Run and tell that.
Andrey Boemmel - None
Tomball is actually one of the nicer parts of Houston metro also Freeport is chemical industry city I guess you could say whear a person with no education can get a 50 k + a year job as far as the rest their mainly towns in the so called valley and yes it's pretty poor down there except for eagle ford shale oilfield. Anyways i driove a truck for a living and I live in gilmer tx and I know who ever made this video don't know what their talking about. I want to know whear this person lives at. Not only is Texas a surplus state financially but we are also one of the most modern and advanced states in the country
raychel ._.memes - None
Come down to Tomball Texas where theres a parade every year in August and You dont give a s**t where you park as long as you can find your car.
ashley love - None
I've lived in Tomball my entire life and tbh it's pretty nice. There's not really much crime and the traffic isn't really that bad. But you're right about the cost of living
ashley love - None
Lol I'm from Tomball and the majority of the people here are old as h**l
Cameron Harper - None
WAIT A MINUTE!!!!! I LIVE IN TOMBALL AND ITS NOT THAT BAD!!--!-!
Christian Sandoval - None
I live in Tomball it's actually pretty great good people everywhere
Disstrack Prod. - None
I live in tomball and it's no where near that bad
Overton Croomes - None
I live in tomball and it's actually nice.
HomeSnacks User - None
I have lived in Tomball for 21 years and I teach in Tomball. I could not be more proud of this little piece of paradise. Love the main street parades that honor our veterans, athletes, and little league teams. We show our kids that they are important and if you look at the scores for our schools you would be looking for one of those empty houses to move your family into.
Rankings for Tomball in Texas


Locations Around Tomball
Map Of Tomball, TX
Best Places Around Tomball
West University Place, TX
Population 14,907
Four Corners, TX
Population 11,490
Bellaire, TX
Population 17,116
Cinco Ranch, TX
Population 19,139
Friendswood, TX
Population 40,827
Mission Bend, TX
Population 37,280
Sugar Land, TX
Population 109,735
Deer Park, TX
Population 33,823
Tomball Demographics And Statistics
Population over time in Tomball
The current population in Tomball is 13,032. The population has increased 24.9% from 2010.
| Year | Population | % Change |
|---|---|---|
| 2023 | 13,032 | 3.2% |
| 2022 | 12,630 | 2.4% |
| 2021 | 12,333 | 5.5% |
| 2020 | 11,689 | 0.0% |
| 2019 | 11,689 | 0.4% |
| 2018 | 11,644 | 0.9% |
| 2017 | 11,535 | 1.6% |
| 2016 | 11,353 | 1.5% |
| 2015 | 11,186 | 1.4% |
| 2014 | 11,030 | 1.2% |
| 2013 | 10,898 | 1.5% |
| 2012 | 10,732 | 1.1% |
| 2011 | 10,610 | 1.7% |
| 2010 | 10,435 | - |
Race / Ethnicity in Tomball
Tomball is:
63.6% White with 8,288 White residents.
9.6% African American with 1,247 African American residents.
0.1% American Indian with 14 American Indian residents.
0.9% Asian with 112 Asian residents.
0.0% Hawaiian with 0 Hawaiian residents.
0.2% Other with 30 Other residents.
2.5% Two Or More with 322 Two Or More residents.
23.2% Hispanic with 3,019 Hispanic residents.
| Race | Tomball | TX | USA |
|---|---|---|---|
| White | 63.6% | 39.9% | 58.2% |
| African American | 9.6% | 11.9% | 12.0% |
| American Indian | 0.1% | 0.2% | 0.5% |
| Asian | 0.9% | 5.3% | 5.7% |
| Hawaiian | 0.0% | 0.1% | 0.2% |
| Other | 0.2% | 0.4% | 0.5% |
| Two Or More | 2.5% | 2.9% | 3.9% |
| Hispanic | 23.2% | 39.5% | 19.0% |
Gender in Tomball
Tomball is 52.2% female with 6,798 female residents.
Tomball is 47.8% male with 6,233 male residents.
| Gender | Tomball | TX | USA |
|---|---|---|---|
| Female | 52.2% | 50.1% | 50.5% |
| Male | 47.8% | 49.9% | 49.5% |
Highest level of educational attainment in Tomball for adults over 25
7.0% of adults in Tomball completed < 9th grade.
5.0% of adults in Tomball completed 9-12th grade.
22.0% of adults in Tomball completed high school / ged.
25.0% of adults in Tomball completed some college.
9.0% of adults in Tomball completed associate's degree.
20.0% of adults in Tomball completed bachelor's degree.
10.0% of adults in Tomball completed master's degree.
1.0% of adults in Tomball completed professional degree.
1.0% of adults in Tomball completed doctorate degree.
| Education | Tomball | TX | USA |
|---|---|---|---|
| < 9th Grade | 7.0% | 7.0% | 5.0% |
| 9-12th Grade | 5.0% | 7.0% | 6.0% |
| High School / GED | 22.0% | 24.0% | 26.0% |
| Some College | 25.0% | 21.0% | 19.0% |
| Associate's Degree | 9.0% | 8.0% | 9.0% |
| Bachelor's Degree | 20.0% | 21.0% | 21.0% |
| Master's Degree | 10.0% | 9.0% | 10.0% |
| Professional Degree | 1.0% | 2.0% | 2.0% |
| Doctorate Degree | 1.0% | 1.0% | 2.0% |
Household Income For Tomball, Texas
5.3% of households in Tomball earn Less than $10,000.
3.8% of households in Tomball earn $10,000 to $14,999.
6.5% of households in Tomball earn $15,000 to $24,999.
11.5% of households in Tomball earn $25,000 to $34,999.
13.5% of households in Tomball earn $35,000 to $49,999.
11.0% of households in Tomball earn $50,000 to $74,999.
15.4% of households in Tomball earn $75,000 to $99,999.
12.8% of households in Tomball earn $100,000 to $149,999.
9.2% of households in Tomball earn $150,000 to $199,999.
11.0% of households in Tomball earn $200,000 or more.
| Income | Tomball | TX | USA |
|---|---|---|---|
| Less than $10,000 | 5.3% | 5.0% | 4.9% |
| $10,000 to $14,999 | 3.8% | 3.4% | 3.6% |
| $15,000 to $24,999 | 6.5% | 6.5% | 6.6% |
| $25,000 to $34,999 | 11.5% | 7.0% | 6.8% |
| $35,000 to $49,999 | 13.5% | 10.9% | 10.4% |
| $50,000 to $74,999 | 11.0% | 16.4% | 15.7% |
| $75,000 to $99,999 | 15.4% | 12.8% | 12.7% |
| $100,000 to $149,999 | 12.8% | 17.2% | 17.4% |
| $150,000 to $199,999 | 9.2% | 9.1% | 9.3% |
| $200,000 or more | 11.0% | 11.7% | 12.6% |


