Waxahachie SnackAbility
Overall SnackAbility
Crime in Waxahachie summary. We use data from the FBI to determine the crime rates in Waxahachie. Key points include:
There were 883 total crimes in Waxahachie in the last reporting year.
The overall crime rate per 100,000 people in Waxahachie is 1,793.9 / 100k people.
The violent crime rate per 100,000 people in Waxahachie is 223.5 / 100k people.
The property crime rate per 100,000 people in Waxahachie is 1,570.4 / 100k people.
Overall, crime in Waxahachie is -15.35% below the national average.
Total Crimes
Below National Average
Crime In Waxahachie Comparison Table
| Statistic | Count Raw |
Waxahachie / 100k People |
Texas / 100k People |
National / 100k People |
|---|---|---|---|---|
| Total Crimes Per 100K | 883 | 1,793.9 | 2,429.9 | 2,119.2 |
| Violent Crime | 110 | 223.5 | 389.4 | 359.0 |
| Murder | 2 | 4.1 | 5.2 | 5.0 |
| Robbery | 5 | 10.2 | 63.5 | 61.0 |
| Aggravated Assault | 78 | 158.5 | 270.7 | 256.0 |
| Property Crime | 773 | 1,570.4 | 2,040.5 | 1,760.0 |
| Burglary | 60 | 121.9 | 284.3 | 229.0 |
| Larceny | 633 | 1,286.0 | 1,425.6 | 1,272.0 |
| Car Theft | 80 | 162.5 | 330.7 | 259.0 |
Source: FBI Uniform Crime Reporting (2024)
Cost of living in Waxahachie summary. We use data on the cost of living to determine how expensive it is to live in Waxahachie. Real estate prices drive most of the variance in cost of living around Texas. Key points include:
The cost of living in Waxahachie is 102 with 100 being average.
The cost of living in Waxahachie is 1.0x higher than the national average.
The median home value in Waxahachie is $370,256.
The median income in Waxahachie is $85,723.
Waxahachie's Overall Cost Of Living
Higher Than The National Average
Cost Of Living In Waxahachie Comparison Table
| Living Expense | Waxahachie | Texas | National Average |
|---|---|---|---|
| Overall | 102 | 93 | 100 |
| Services | 97 | 100 | 100 |
| Groceries | 101 | 99 | 100 |
| Health | 113 | 81 | 100 |
| Housing | 96 | 97 | 100 |
| Transportation | 102 | 103 | 100 |
| Utilities | 97 | 100 | 100 |
Source: Cost of living index, normalized to US average = 100
Waxahachie, TX Weather
The average high in Waxahachie is 76.3° and the average low is 54.5°.
There are 55.6 days of precipitation each year.
Expect an average of 38.8 inches of precipitation each year with 0.2 inches of snow.
| Stat | Waxahachie |
|---|---|
| Average Annual High | 76.3 |
| Average Annual Low | 54.5 |
| Annual Precipitation Days | 55.6 |
| Average Annual Precipitation | 38.8 |
| Average Annual Snowfall | 0.2 |
Average High
Days of Rain
Source: NOAA climate normals (30-year)
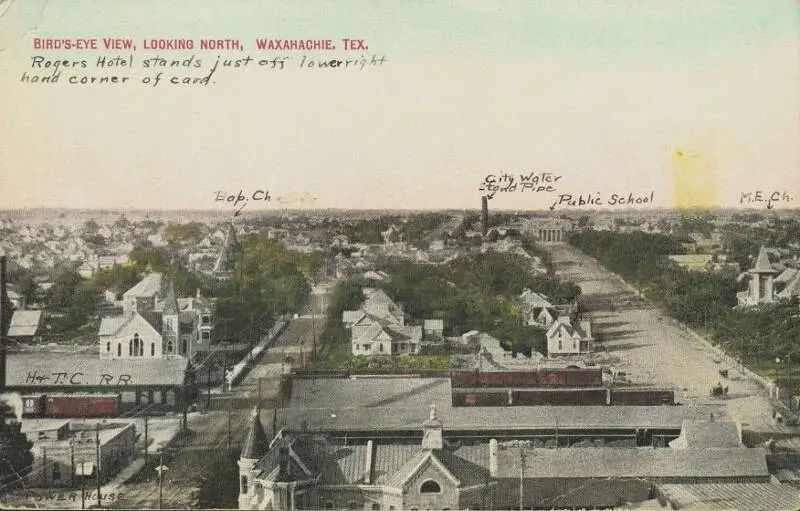
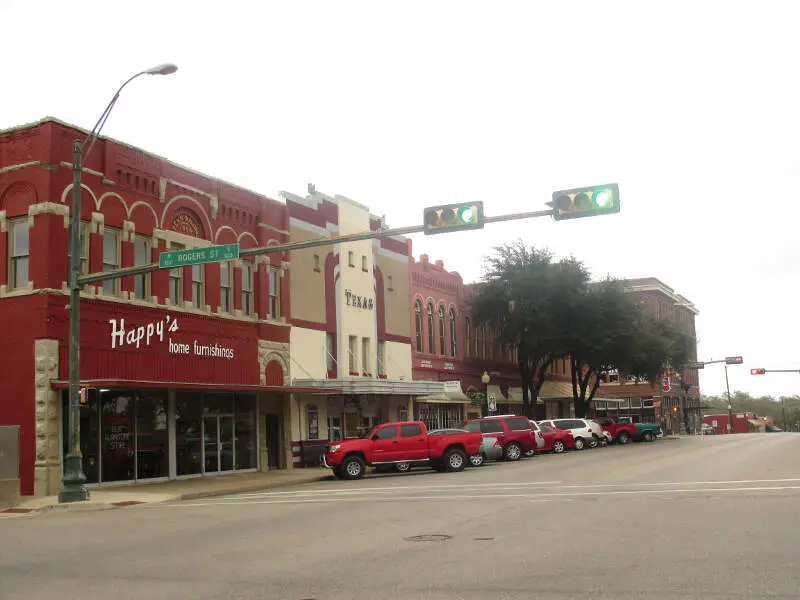
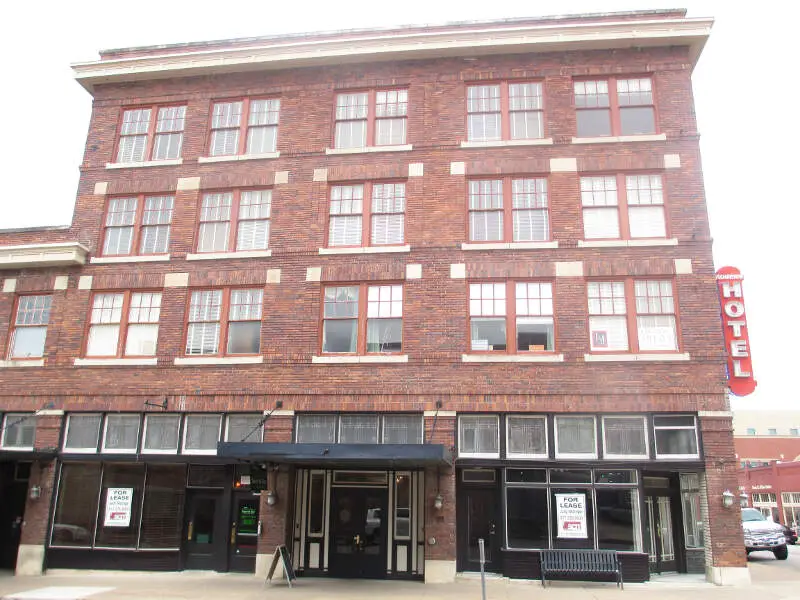
Waxahachie, TX Photos


Rankings & Articles For Waxahachie


Locations Around Waxahachie
Map Of Waxahachie, TX
Best Places Around Waxahachie
Mansfield, TX
Population 77,510
Duncanville, TX
Population 39,683
Ennis, TX
Population 22,588
Red Oak, TX
Population 17,077
Midlothian, TX
Population 39,356
DeSoto, TX
Population 56,211
Cedar Hill, TX
Population 48,879
Glenn Heights, TX
Population 18,096
Lancaster, TX
Population 40,820
Waxahachie Demographics And Statistics
Population over time in Waxahachie
The current population in Waxahachie is 45,347. The population has increased 60.4% from 2010.
| Year | Population | % Change |
|---|---|---|
| 2024 | 45,347 | 4.0% |
| 2023 | 43,591 | 4.3% |
| 2022 | 41,801 | 5.0% |
| 2021 | 39,815 | 8.4% |
| 2020 | 36,735 | 3.8% |
| 2019 | 35,376 | 3.2% |
| 2018 | 34,285 | 3.1% |
| 2017 | 33,240 | 2.2% |
| 2016 | 32,536 | 2.5% |
| 2015 | 31,756 | 2.3% |
| 2014 | 31,045 | 2.1% |
| 2013 | 30,412 | 2.2% |
| 2012 | 29,760 | 2.5% |
| 2011 | 29,033 | 2.7% |
| 2010 | 28,276 | - |
Race / Ethnicity in Waxahachie
See the full breakdown
Waxahachie is:
51.9% White with 23,516 White residents.
17.1% African American with 7,772 African American residents.
0.2% American Indian with 86 American Indian residents.
0.9% Asian with 398 Asian residents.
0.5% Hawaiian with 207 Hawaiian residents.
0.7% Other with 301 Other residents.
3.4% Two Or More with 1,520 Two Or More residents.
25.5% Hispanic with 11,547 Hispanic residents.
| Race | Waxahachie | TX | USA |
|---|---|---|---|
| White | 51.9% | 39.1% | 57.4% |
| African American | 17.1% | 11.9% | 11.9% |
| American Indian | 0.2% | 0.1% | 0.5% |
| Asian | 0.9% | 5.5% | 5.9% |
| Hawaiian | 0.5% | 0.1% | 0.2% |
| Other | 0.7% | 0.4% | 0.6% |
| Two Or More | 3.4% | 3.1% | 4.3% |
| Hispanic | 25.5% | 39.7% | 19.3% |
Gender in Waxahachie
See the full breakdown
Waxahachie is 52.2% female with 23,659 female residents.
Waxahachie is 47.8% male with 21,688 male residents.
| Gender | Waxahachie | TX | USA |
|---|---|---|---|
| Female | 52.2% | 50.1% | 50.5% |
| Male | 47.8% | 49.9% | 49.5% |
Highest level of educational attainment in Waxahachie for adults over 25
See the full breakdown
5.0% of adults in Waxahachie completed < 9th grade.
5.0% of adults in Waxahachie completed 9-12th grade.
25.0% of adults in Waxahachie completed high school / ged.
23.0% of adults in Waxahachie completed some college.
10.0% of adults in Waxahachie completed associate's degree.
20.0% of adults in Waxahachie completed bachelor's degree.
10.0% of adults in Waxahachie completed master's degree.
1.0% of adults in Waxahachie completed professional degree.
1.0% of adults in Waxahachie completed doctorate degree.
| Education | Waxahachie | TX | USA |
|---|---|---|---|
| < 9th Grade | 5.0% | 8.0% | 4.0% |
| 9-12th Grade | 5.0% | 7.0% | 6.0% |
| High School / GED | 25.0% | 24.0% | 26.0% |
| Some College | 23.0% | 20.0% | 19.0% |
| Associate's Degree | 10.0% | 8.0% | 9.0% |
| Bachelor's Degree | 20.0% | 21.0% | 22.0% |
| Master's Degree | 10.0% | 9.0% | 10.0% |
| Professional Degree | 1.0% | 2.0% | 2.0% |
| Doctorate Degree | 1.0% | 1.0% | 2.0% |
Household Income For Waxahachie, Texas
See the full breakdown
3.2% of households in Waxahachie earn Less than $10,000.
2.2% of households in Waxahachie earn $10,000 to $14,999.
4.2% of households in Waxahachie earn $15,000 to $24,999.
6.9% of households in Waxahachie earn $25,000 to $34,999.
9.2% of households in Waxahachie earn $35,000 to $49,999.
16.8% of households in Waxahachie earn $50,000 to $74,999.
17.6% of households in Waxahachie earn $75,000 to $99,999.
19.3% of households in Waxahachie earn $100,000 to $149,999.
10.7% of households in Waxahachie earn $150,000 to $199,999.
10.0% of households in Waxahachie earn $200,000 or more.
| Income | Waxahachie | TX | USA |
|---|---|---|---|
| Less than $10,000 | 3.2% | 5.0% | 5.0% |
| $10,000 to $14,999 | 2.2% | 3.3% | 3.4% |
| $15,000 to $24,999 | 4.2% | 6.3% | 6.3% |
| $25,000 to $34,999 | 6.9% | 6.8% | 6.6% |
| $35,000 to $49,999 | 9.2% | 10.5% | 10.1% |
| $50,000 to $74,999 | 16.8% | 16.1% | 15.5% |
| $75,000 to $99,999 | 17.6% | 12.8% | 12.6% |
| $100,000 to $149,999 | 19.3% | 17.3% | 17.5% |
| $150,000 to $199,999 | 10.7% | 9.5% | 9.6% |
| $200,000 or more | 10.0% | 12.5% | 13.4% |
Source: U.S. Census ACS 5-year estimates (2024)


