Waxahachie, TX
Demographics And Statistics
Living In Waxahachie, Texas Summary
Life in Waxahachie research summary. HomeSnacks has been using Saturday Night Science to research the quality of life in Waxahachie over the past nine years using Census, FBI, Zillow, and other primary data sources. Based on the most recently available data, we found the following about life in Waxahachie:
The population in Waxahachie is 43,591.
The median home value in Waxahachie is $365,887.
The median income in Waxahachie is $82,449.
The cost of living in Waxahachie is 108 which is 1.1x higher than the national average.
The median rent in Waxahachie is $1,495.
The unemployment rate in Waxahachie is 2.6%.
The poverty rate in Waxahachie is 8.8%.
The average high in Waxahachie is 76.3° and the average low is 54.5°.
Waxahachie SnackAbility
Overall SnackAbility
Waxahachie, TX Crime Report
Crime in Waxahachie summary. We use data from the FBI to determine the crime rates in Waxahachie. Key points include:
There were 883 total crimes in Waxahachie in the last reporting year.
The overall crime rate per 100,000 people in Waxahachie is 1,793.9 / 100k people.
The violent crime rate per 100,000 people in Waxahachie is 223.5 / 100k people.
The property crime rate per 100,000 people in Waxahachie is 1,570.4 / 100k people.
Overall, crime in Waxahachie is -15.35% below the national average.
Total Crimes
Below National Average
Crime In Waxahachie Comparison Table
| Statistic | Count Raw |
Waxahachie / 100k People |
Texas / 100k People |
National / 100k People |
|---|---|---|---|---|
| Total Crimes Per 100K | 883 | 1,793.9 | 2,429.9 | 2,119.2 |
| Violent Crime | 110 | 223.5 | 389.4 | 359.0 |
| Murder | 2 | 4.1 | 5.2 | 5.0 |
| Robbery | 5 | 10.2 | 63.5 | 61.0 |
| Aggravated Assault | 78 | 158.5 | 270.7 | 256.0 |
| Property Crime | 773 | 1,570.4 | 2,040.5 | 1,760.0 |
| Burglary | 60 | 121.9 | 284.3 | 229.0 |
| Larceny | 633 | 1,286.0 | 1,425.6 | 1,272.0 |
| Car Theft | 80 | 162.5 | 330.7 | 259.0 |
Waxahachie, TX Cost Of Living
Cost of living in Waxahachie summary. We use data on the cost of living to determine how expensive it is to live in Waxahachie. Real estate prices drive most of the variance in cost of living around Texas. Key points include:
The cost of living in Waxahachie is 108 with 100 being average.
The cost of living in Waxahachie is 1.1x higher than the national average.
The median home value in Waxahachie is $365,887.
The median income in Waxahachie is $82,449.
Waxahachie's Overall Cost Of Living
Higher Than The National Average
Cost Of Living In Waxahachie Comparison Table
| Living Expense | Waxahachie | Texas | National Average | |
|---|---|---|---|---|
| Overall | 108 | 92 | 100 | |
| Services | 108 | 97 | 100 | |
| Groceries | 101 | 97 | 100 | |
| Health | 106 | 93 | 100 | |
| Housing | 112 | 82 | 100 | |
| Transportation | 89 | 94 | 100 | |
| Utilities | 111 | 104 | 100 | |
Waxahachie, TX Weather
The average high in Waxahachie is 76.3° and the average low is 54.5°.
There are 55.6 days of precipitation each year.
Expect an average of 38.8 inches of precipitation each year with 0.2 inches of snow.
| Stat | Waxahachie |
|---|---|
| Average Annual High | 76.3 |
| Average Annual Low | 54.5 |
| Annual Precipitation Days | 55.6 |
| Average Annual Precipitation | 38.8 |
| Average Annual Snowfall | 0.2 |
Average High
Days of Rain
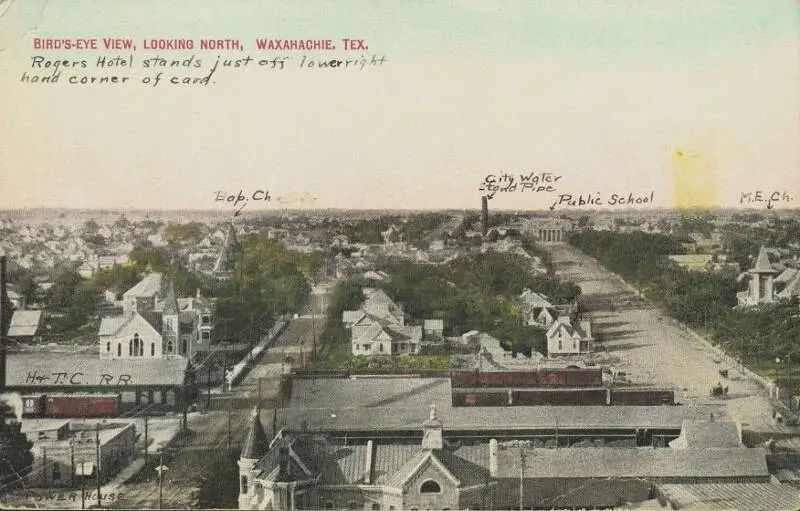
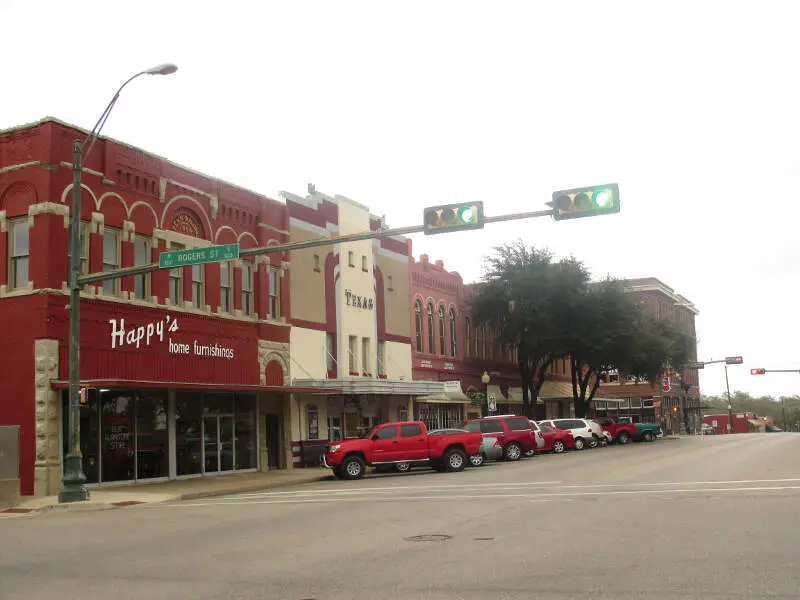
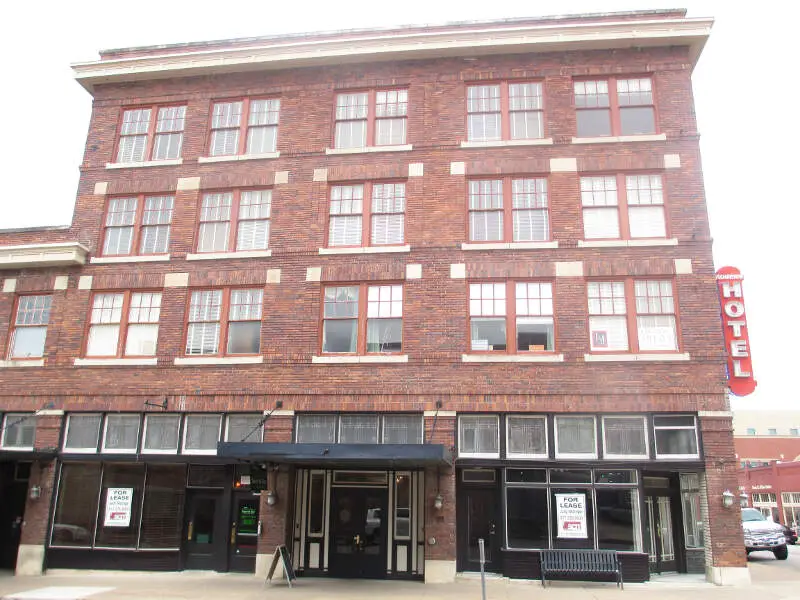
Waxahachie, TX Photos


Rankings for Waxahachie in Texas


Locations Around Waxahachie
Map Of Waxahachie, TX
Best Places Around Waxahachie
Mansfield, TX
Population 75,398
Duncanville, TX
Population 39,879
Ennis, TX
Population 21,546
Red Oak, TX
Population 15,909
Midlothian, TX
Population 37,256
DeSoto, TX
Population 55,896
Cedar Hill, TX
Population 48,547
Glenn Heights, TX
Population 17,175
Lancaster, TX
Population 40,753
Waxahachie Demographics And Statistics
Population over time in Waxahachie
The current population in Waxahachie is 43,591. The population has increased 54.2% from 2010.
| Year | Population | % Change |
|---|---|---|
| 2023 | 43,591 | 4.3% |
| 2022 | 41,801 | 5.0% |
| 2021 | 39,815 | 8.4% |
| 2020 | 36,735 | 3.8% |
| 2019 | 35,376 | 3.2% |
| 2018 | 34,285 | 3.1% |
| 2017 | 33,240 | 2.2% |
| 2016 | 32,536 | 2.5% |
| 2015 | 31,756 | 2.3% |
| 2014 | 31,045 | 2.1% |
| 2013 | 30,412 | 2.2% |
| 2012 | 29,760 | 2.5% |
| 2011 | 29,033 | 2.7% |
| 2010 | 28,276 | - |
Race / Ethnicity in Waxahachie
Waxahachie is:
55.1% White with 24,036 White residents.
15.1% African American with 6,598 African American residents.
0.2% American Indian with 81 American Indian residents.
0.8% Asian with 350 Asian residents.
0.5% Hawaiian with 209 Hawaiian residents.
0.5% Other with 216 Other residents.
3.4% Two Or More with 1,470 Two Or More residents.
24.4% Hispanic with 10,631 Hispanic residents.
| Race | Waxahachie | TX | USA |
|---|---|---|---|
| White | 55.1% | 39.9% | 58.2% |
| African American | 15.1% | 11.9% | 12.0% |
| American Indian | 0.2% | 0.2% | 0.5% |
| Asian | 0.8% | 5.3% | 5.7% |
| Hawaiian | 0.5% | 0.1% | 0.2% |
| Other | 0.5% | 0.4% | 0.5% |
| Two Or More | 3.4% | 2.9% | 3.9% |
| Hispanic | 24.4% | 39.5% | 19.0% |
Gender in Waxahachie
Waxahachie is 52.5% female with 22,875 female residents.
Waxahachie is 47.5% male with 20,715 male residents.
| Gender | Waxahachie | TX | USA |
|---|---|---|---|
| Female | 52.5% | 50.1% | 50.5% |
| Male | 47.5% | 49.9% | 49.5% |
Highest level of educational attainment in Waxahachie for adults over 25
6.0% of adults in Waxahachie completed < 9th grade.
5.0% of adults in Waxahachie completed 9-12th grade.
25.0% of adults in Waxahachie completed high school / ged.
26.0% of adults in Waxahachie completed some college.
10.0% of adults in Waxahachie completed associate's degree.
17.0% of adults in Waxahachie completed bachelor's degree.
9.0% of adults in Waxahachie completed master's degree.
1.0% of adults in Waxahachie completed professional degree.
1.0% of adults in Waxahachie completed doctorate degree.
| Education | Waxahachie | TX | USA |
|---|---|---|---|
| < 9th Grade | 6.0% | 7.0% | 5.0% |
| 9-12th Grade | 5.0% | 7.0% | 6.0% |
| High School / GED | 25.0% | 24.0% | 26.0% |
| Some College | 26.0% | 21.0% | 19.0% |
| Associate's Degree | 10.0% | 8.0% | 9.0% |
| Bachelor's Degree | 17.0% | 21.0% | 21.0% |
| Master's Degree | 9.0% | 9.0% | 10.0% |
| Professional Degree | 1.0% | 2.0% | 2.0% |
| Doctorate Degree | 1.0% | 1.0% | 2.0% |
Household Income For Waxahachie, Texas
3.1% of households in Waxahachie earn Less than $10,000.
1.9% of households in Waxahachie earn $10,000 to $14,999.
4.7% of households in Waxahachie earn $15,000 to $24,999.
7.4% of households in Waxahachie earn $25,000 to $34,999.
10.0% of households in Waxahachie earn $35,000 to $49,999.
17.1% of households in Waxahachie earn $50,000 to $74,999.
17.4% of households in Waxahachie earn $75,000 to $99,999.
21.6% of households in Waxahachie earn $100,000 to $149,999.
9.8% of households in Waxahachie earn $150,000 to $199,999.
7.0% of households in Waxahachie earn $200,000 or more.
| Income | Waxahachie | TX | USA |
|---|---|---|---|
| Less than $10,000 | 3.1% | 5.0% | 4.9% |
| $10,000 to $14,999 | 1.9% | 3.4% | 3.6% |
| $15,000 to $24,999 | 4.7% | 6.5% | 6.6% |
| $25,000 to $34,999 | 7.4% | 7.0% | 6.8% |
| $35,000 to $49,999 | 10.0% | 10.9% | 10.4% |
| $50,000 to $74,999 | 17.1% | 16.4% | 15.7% |
| $75,000 to $99,999 | 17.4% | 12.8% | 12.7% |
| $100,000 to $149,999 | 21.6% | 17.2% | 17.4% |
| $150,000 to $199,999 | 9.8% | 9.1% | 9.3% |
| $200,000 or more | 7.0% | 11.7% | 12.6% |


