Wichita Falls SnackAbility
Overall SnackAbility
Crime in Wichita Falls summary. We use data from the FBI to determine the crime rates in Wichita Falls. Key points include:
There were 3,051 total crimes in Wichita Falls in the last reporting year.
The overall crime rate per 100,000 people in Wichita Falls is 2,969.0 / 100k people.
The violent crime rate per 100,000 people in Wichita Falls is 350.3 / 100k people.
The property crime rate per 100,000 people in Wichita Falls is 2,618.7 / 100k people.
Overall, crime in Wichita Falls is 40.10% above the national average.
Total Crimes
Above National Average
Crime In Wichita Falls Comparison Table
| Statistic | Count Raw |
Wichita Falls / 100k People |
Texas / 100k People |
National / 100k People |
|---|---|---|---|---|
| Total Crimes Per 100K | 3,051 | 2,969.0 | 2,429.9 | 2,119.2 |
| Violent Crime | 360 | 350.3 | 389.4 | 359.0 |
| Murder | 9 | 8.8 | 5.2 | 5.0 |
| Robbery | 61 | 59.4 | 63.5 | 61.0 |
| Aggravated Assault | 225 | 219.0 | 270.7 | 256.0 |
| Property Crime | 2,691 | 2,618.7 | 2,040.5 | 1,760.0 |
| Burglary | 457 | 444.7 | 284.3 | 229.0 |
| Larceny | 1,982 | 1,928.7 | 1,425.6 | 1,272.0 |
| Car Theft | 252 | 245.2 | 330.7 | 259.0 |
Source: FBI Uniform Crime Reporting (2024)
Cost of living in Wichita Falls summary. We use data on the cost of living to determine how expensive it is to live in Wichita Falls. Real estate prices drive most of the variance in cost of living around Texas. Key points include:
The cost of living in Wichita Falls is 91 with 100 being average.
The cost of living in Wichita Falls is 0.9x lower than the national average.
The median home value in Wichita Falls is $172,050.
The median income in Wichita Falls is $60,177.
Wichita Falls's Overall Cost Of Living
Lower Than The National Average
Cost Of Living In Wichita Falls Comparison Table
| Living Expense | Wichita Falls | Texas | National Average |
|---|---|---|---|
| Overall | 91 | 93 | 100 |
| Services | 99 | 100 | 100 |
| Groceries | 99 | 99 | 100 |
| Health | 70 | 81 | 100 |
| Housing | 95 | 97 | 100 |
| Transportation | 106 | 103 | 100 |
| Utilities | 96 | 100 | 100 |
Source: Cost of living index, normalized to US average = 100
Wichita Falls, TX Weather
The average high in Wichita Falls is 75.8° and the average low is 51.3°.
There are 44.5 days of precipitation each year.
Expect an average of 29.8 inches of precipitation each year with 3.2 inches of snow.
| Stat | Wichita Falls |
|---|---|
| Average Annual High | 75.8 |
| Average Annual Low | 51.3 |
| Annual Precipitation Days | 44.5 |
| Average Annual Precipitation | 29.8 |
| Average Annual Snowfall | 3.2 |
Average High
Days of Rain
Source: NOAA climate normals (30-year)
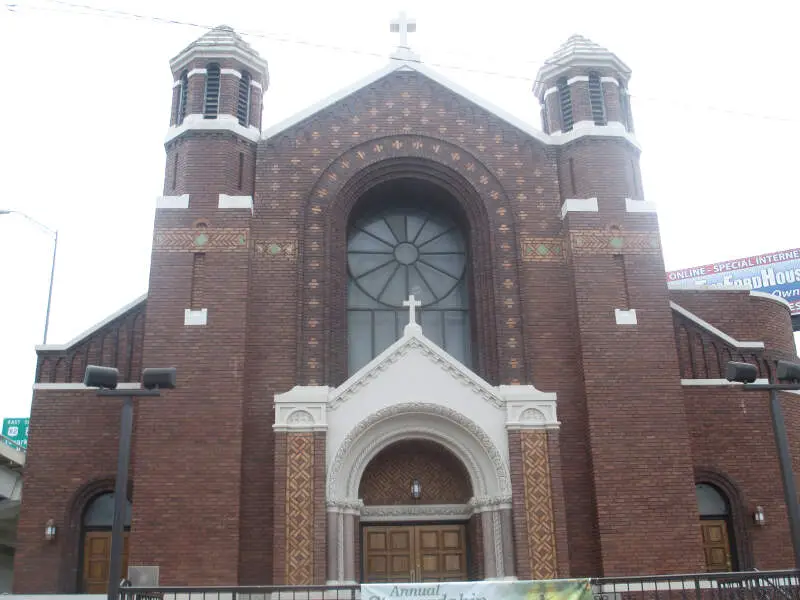
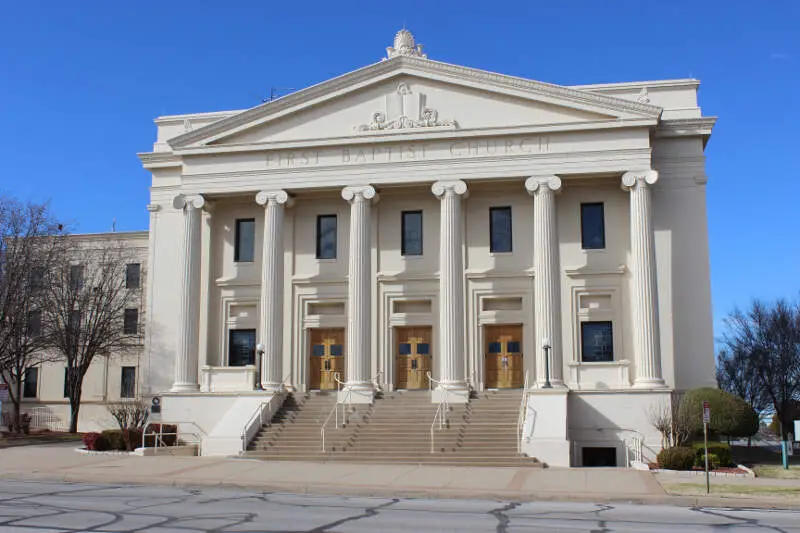
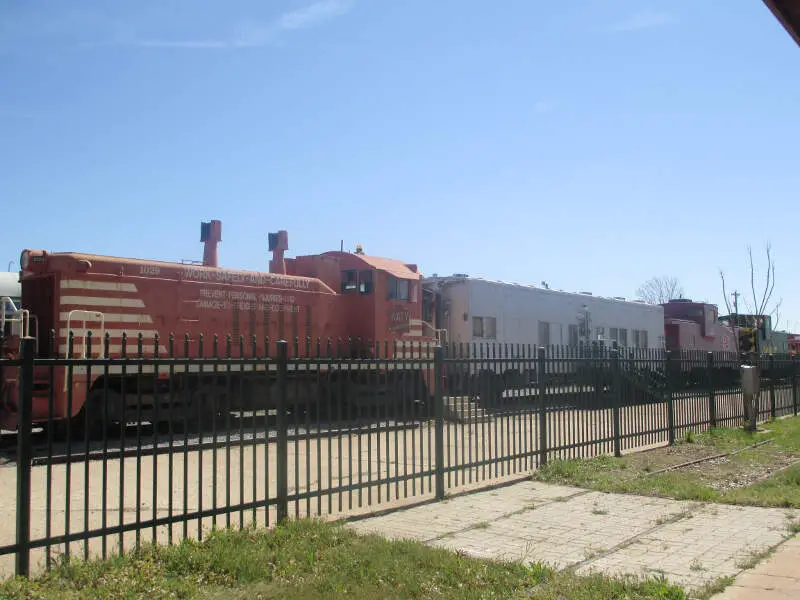
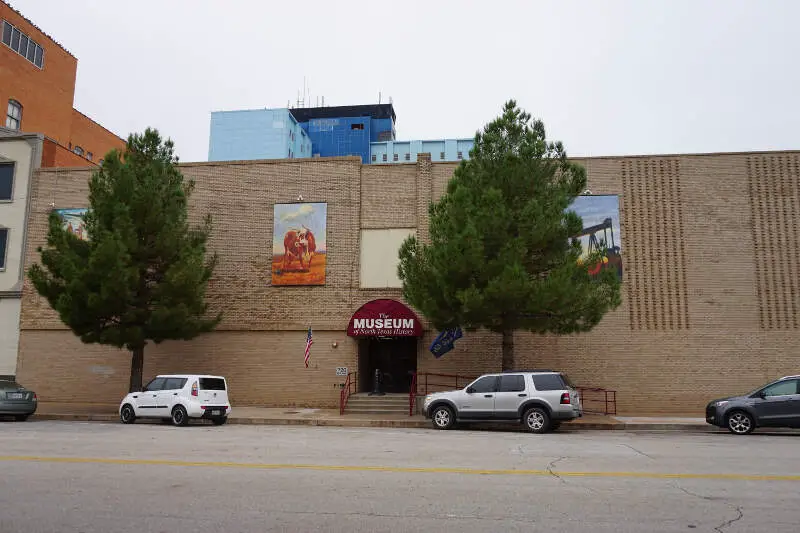
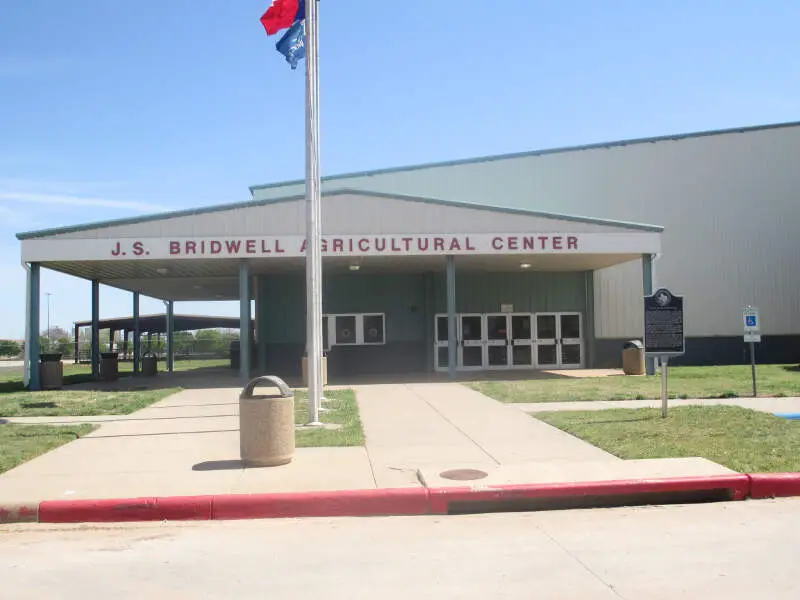
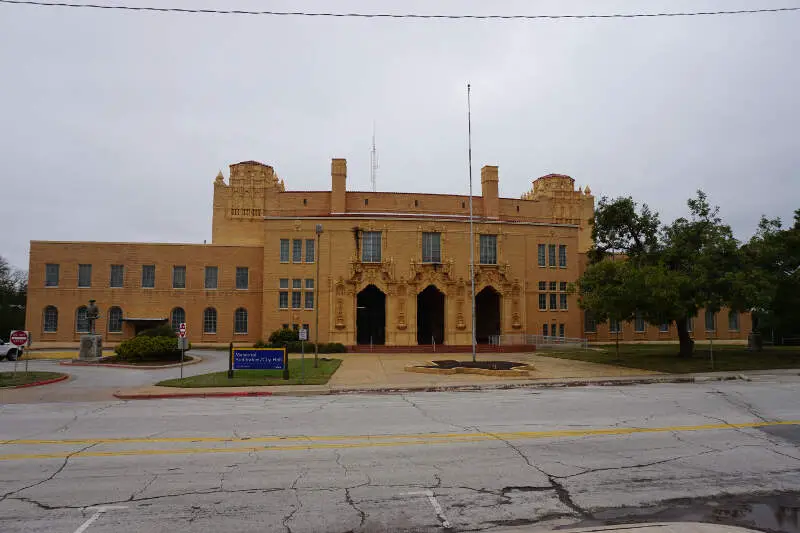
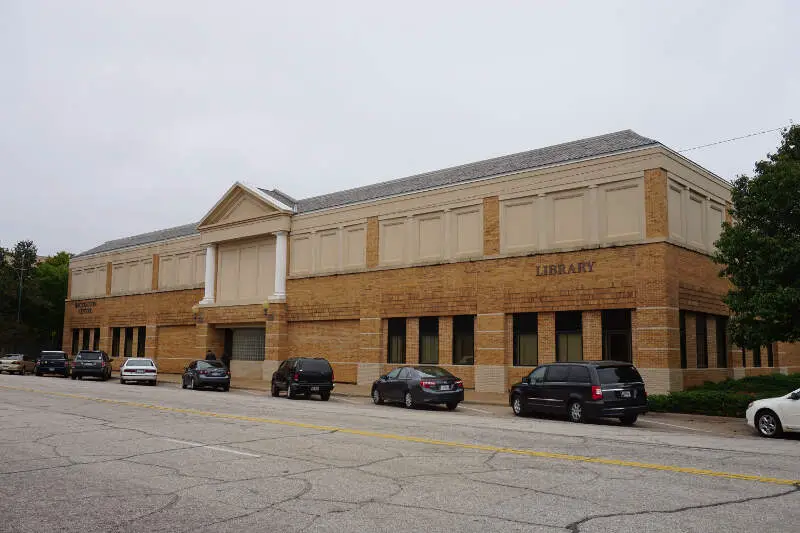
Wichita Falls, TX Photos


1 Reviews & Comments About Wichita Falls

It was speechless, Miracle. I can not believe that incident, what the crime done.
My Favorite place is Los vegas. Because it is most entertainment and more joy place.
Rankings & Articles For Wichita Falls


Locations Around Wichita Falls
Map Of Wichita Falls, TX
Best Places Around Wichita Falls
Vernon, TX
Population 9,848
Burkburnett, TX
Population 11,059
Lakeside, VA
Population 12,654
Lawton, OK
Population 90,595
Wichita Falls Demographics And Statistics
Population over time in Wichita Falls
The current population in Wichita Falls is 102,581. The population has decreased 1.4% from 2010.
| Year | Population | % Change |
|---|---|---|
| 2024 | 102,581 | 0.0% |
| 2023 | 102,558 | 0.1% |
| 2022 | 102,482 | -0.1% |
| 2021 | 102,563 | -2.0% |
| 2020 | 104,657 | 0.4% |
| 2019 | 104,279 | -0.2% |
| 2018 | 104,494 | -0.1% |
| 2017 | 104,621 | -0.4% |
| 2016 | 105,013 | 0.1% |
| 2015 | 104,926 | 0.1% |
| 2014 | 104,771 | 0.4% |
| 2013 | 104,402 | 0.2% |
| 2012 | 104,152 | 0.2% |
| 2011 | 103,973 | -0.1% |
| 2010 | 104,066 | - |
Race / Ethnicity in Wichita Falls
See the full breakdown
Wichita Falls is:
57.1% White with 58,575 White residents.
12.6% African American with 12,943 African American residents.
0.2% American Indian with 223 American Indian residents.
2.6% Asian with 2,715 Asian residents.
0.1% Hawaiian with 149 Hawaiian residents.
0.2% Other with 190 Other residents.
3.9% Two Or More with 3,971 Two Or More residents.
23.2% Hispanic with 23,815 Hispanic residents.
| Race | Wichita Falls | TX | USA |
|---|---|---|---|
| White | 57.1% | 39.1% | 57.4% |
| African American | 12.6% | 11.9% | 11.9% |
| American Indian | 0.2% | 0.1% | 0.5% |
| Asian | 2.6% | 5.5% | 5.9% |
| Hawaiian | 0.1% | 0.1% | 0.2% |
| Other | 0.2% | 0.4% | 0.6% |
| Two Or More | 3.9% | 3.1% | 4.3% |
| Hispanic | 23.2% | 39.7% | 19.3% |
Gender in Wichita Falls
See the full breakdown
Wichita Falls is 47.6% female with 48,860 female residents.
Wichita Falls is 52.4% male with 53,721 male residents.
| Gender | Wichita Falls | TX | USA |
|---|---|---|---|
| Female | 47.6% | 50.1% | 50.5% |
| Male | 52.4% | 49.9% | 49.5% |
Highest level of educational attainment in Wichita Falls for adults over 25
See the full breakdown
8.0% of adults in Wichita Falls completed < 9th grade.
6.0% of adults in Wichita Falls completed 9-12th grade.
30.0% of adults in Wichita Falls completed high school / ged.
23.0% of adults in Wichita Falls completed some college.
8.0% of adults in Wichita Falls completed associate's degree.
17.0% of adults in Wichita Falls completed bachelor's degree.
6.0% of adults in Wichita Falls completed master's degree.
1.0% of adults in Wichita Falls completed professional degree.
1.0% of adults in Wichita Falls completed doctorate degree.
| Education | Wichita Falls | TX | USA |
|---|---|---|---|
| < 9th Grade | 8.0% | 8.0% | 4.0% |
| 9-12th Grade | 6.0% | 7.0% | 6.0% |
| High School / GED | 30.0% | 24.0% | 26.0% |
| Some College | 23.0% | 20.0% | 19.0% |
| Associate's Degree | 8.0% | 8.0% | 9.0% |
| Bachelor's Degree | 17.0% | 21.0% | 22.0% |
| Master's Degree | 6.0% | 9.0% | 10.0% |
| Professional Degree | 1.0% | 2.0% | 2.0% |
| Doctorate Degree | 1.0% | 1.0% | 2.0% |
Household Income For Wichita Falls, Texas
See the full breakdown
6.3% of households in Wichita Falls earn Less than $10,000.
4.8% of households in Wichita Falls earn $10,000 to $14,999.
8.9% of households in Wichita Falls earn $15,000 to $24,999.
8.7% of households in Wichita Falls earn $25,000 to $34,999.
13.8% of households in Wichita Falls earn $35,000 to $49,999.
16.6% of households in Wichita Falls earn $50,000 to $74,999.
12.6% of households in Wichita Falls earn $75,000 to $99,999.
15.0% of households in Wichita Falls earn $100,000 to $149,999.
7.7% of households in Wichita Falls earn $150,000 to $199,999.
5.7% of households in Wichita Falls earn $200,000 or more.
| Income | Wichita Falls | TX | USA |
|---|---|---|---|
| Less than $10,000 | 6.3% | 5.0% | 5.0% |
| $10,000 to $14,999 | 4.8% | 3.3% | 3.4% |
| $15,000 to $24,999 | 8.9% | 6.3% | 6.3% |
| $25,000 to $34,999 | 8.7% | 6.8% | 6.6% |
| $35,000 to $49,999 | 13.8% | 10.5% | 10.1% |
| $50,000 to $74,999 | 16.6% | 16.1% | 15.5% |
| $75,000 to $99,999 | 12.6% | 12.8% | 12.6% |
| $100,000 to $149,999 | 15.0% | 17.3% | 17.5% |
| $150,000 to $199,999 | 7.7% | 9.5% | 9.6% |
| $200,000 or more | 5.7% | 12.5% | 13.4% |
Source: U.S. Census ACS 5-year estimates (2024)


