Ogden SnackAbility
Overall SnackAbility
Crime in Ogden summary. We use data from the FBI to determine the crime rates in Ogden. Key points include:
There were 2,121 total crimes in Ogden in the last reporting year.
The overall crime rate per 100,000 people in Ogden is 2,430.7 / 100k people.
The violent crime rate per 100,000 people in Ogden is 505.4 / 100k people.
The property crime rate per 100,000 people in Ogden is 1,925.3 / 100k people.
Overall, crime in Ogden is 14.70% above the national average.
Total Crimes
Above National Average
Crime In Ogden Comparison Table
| Statistic | Count Raw |
Ogden / 100k People |
Utah / 100k People |
National / 100k People |
|---|---|---|---|---|
| Total Crimes Per 100K | 2,121 | 2,430.7 | 1,638.5 | 2,119.2 |
| Violent Crime | 441 | 505.4 | 229.6 | 359.0 |
| Murder | 2 | 2.3 | 2.6 | 5.0 |
| Robbery | 47 | 53.9 | 27.3 | 61.0 |
| Aggravated Assault | 296 | 339.2 | 141.7 | 256.0 |
| Property Crime | 1,680 | 1,925.3 | 1,408.9 | 1,760.0 |
| Burglary | 202 | 231.5 | 146.6 | 229.0 |
| Larceny | 1,301 | 1,491.0 | 1,145.8 | 1,272.0 |
| Car Theft | 177 | 202.8 | 116.5 | 259.0 |
Source: FBI Uniform Crime Reporting (2024)
Cost of living in Ogden summary. We use data on the cost of living to determine how expensive it is to live in Ogden. Real estate prices drive most of the variance in cost of living around Utah. Key points include:
The cost of living in Ogden is 103 with 100 being average.
The cost of living in Ogden is 1.0x higher than the national average.
The median home value in Ogden is $400,513.
The median income in Ogden is $72,575.
Ogden's Overall Cost Of Living
Higher Than The National Average
Cost Of Living In Ogden Comparison Table
| Living Expense | Ogden | Utah | National Average |
|---|---|---|---|
| Overall | 103 | 106 | 100 |
| Services | 101 | 100 | 100 |
| Groceries | 104 | 101 | 100 |
| Health | 102 | 111 | 100 |
| Housing | 97 | 103 | 100 |
| Transportation | 100 | 103 | 100 |
| Utilities | 102 | 103 | 100 |
Source: Cost of living index, normalized to US average = 100
Ogden, UT Weather
The average high in Ogden is 62.4° and the average low is 39.1°.
There are 50.3 days of precipitation each year.
Expect an average of 19.6 inches of precipitation each year with 43.7 inches of snow.
| Stat | Ogden |
|---|---|
| Average Annual High | 62.4 |
| Average Annual Low | 39.1 |
| Annual Precipitation Days | 50.3 |
| Average Annual Precipitation | 19.6 |
| Average Annual Snowfall | 43.7 |
Average High
Days of Rain
Source: NOAA climate normals (30-year)
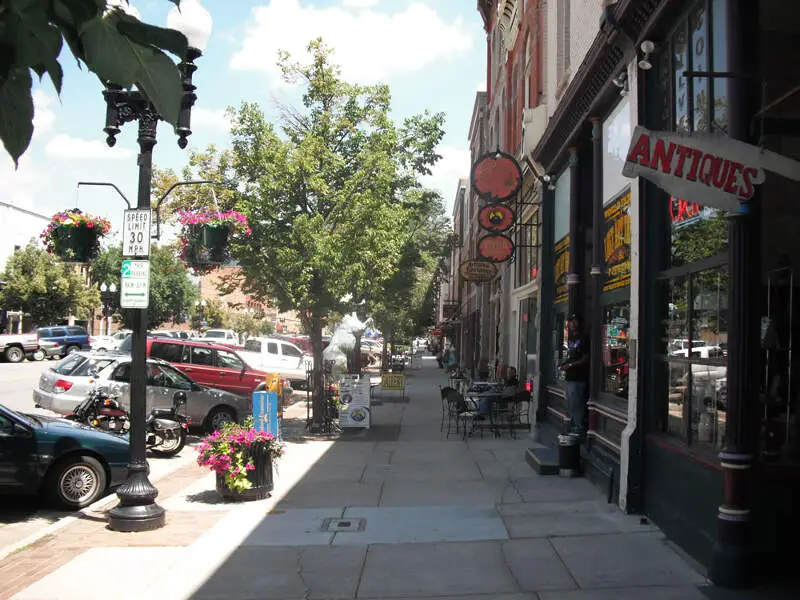
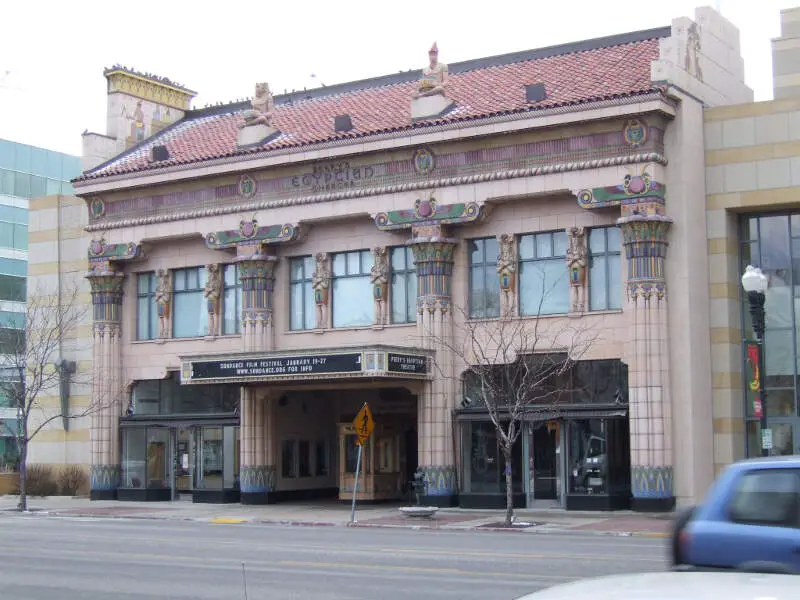
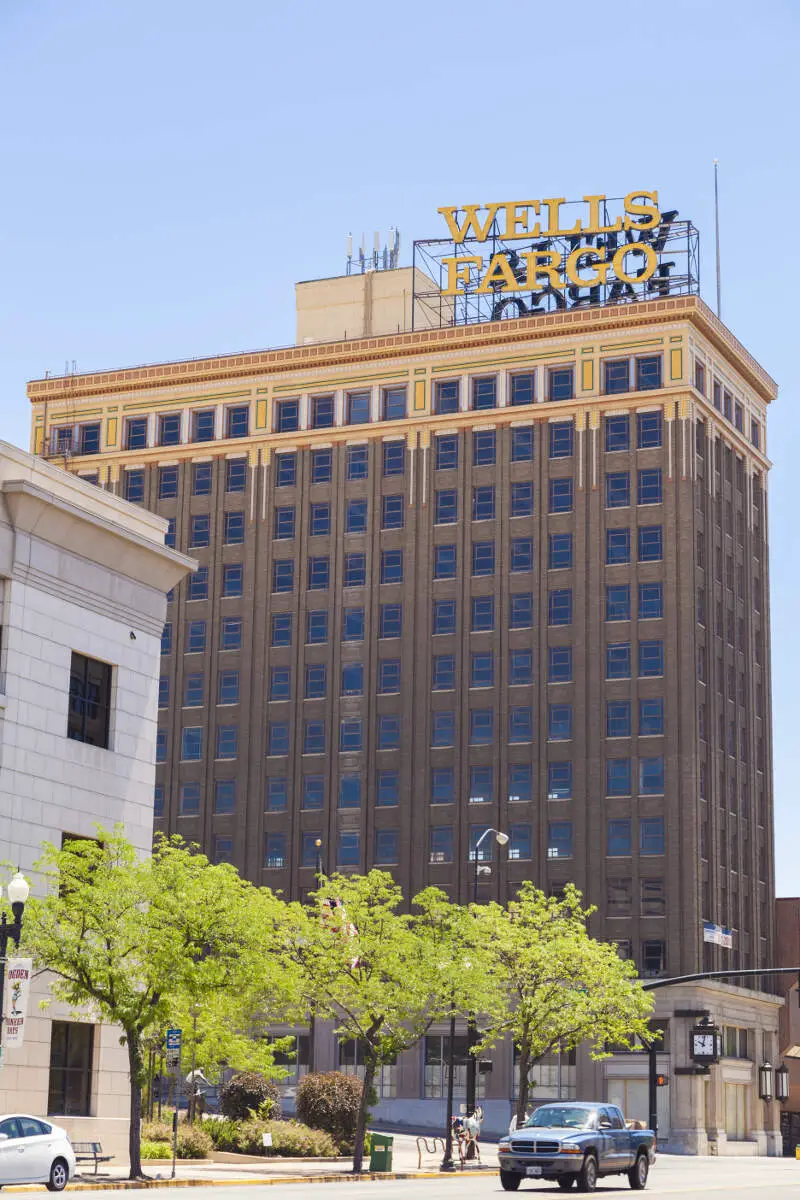
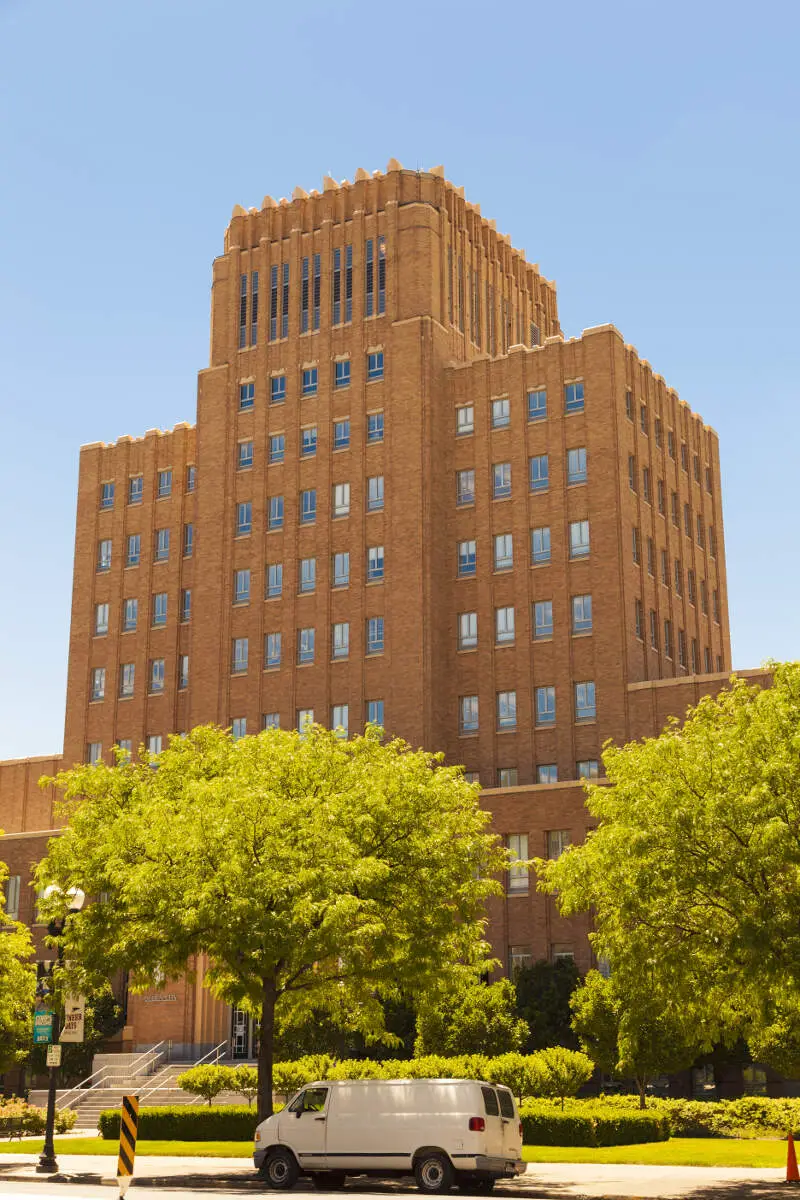
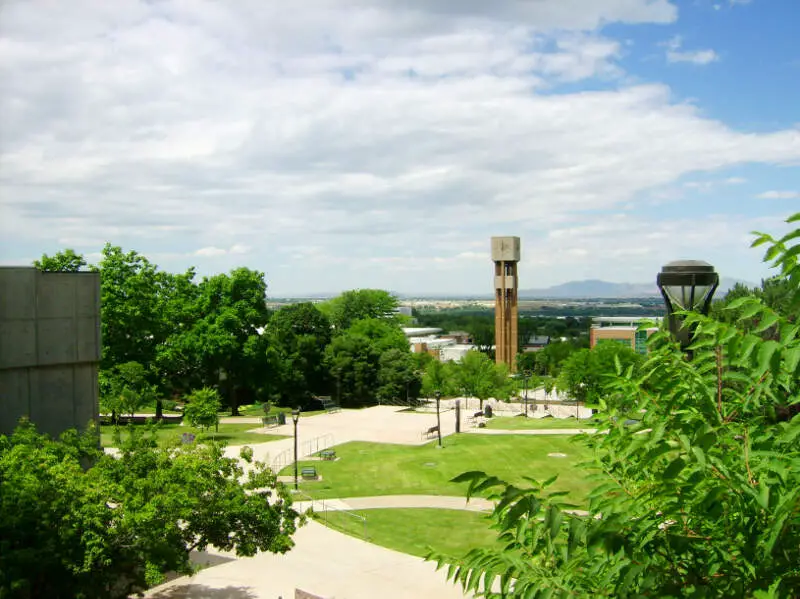
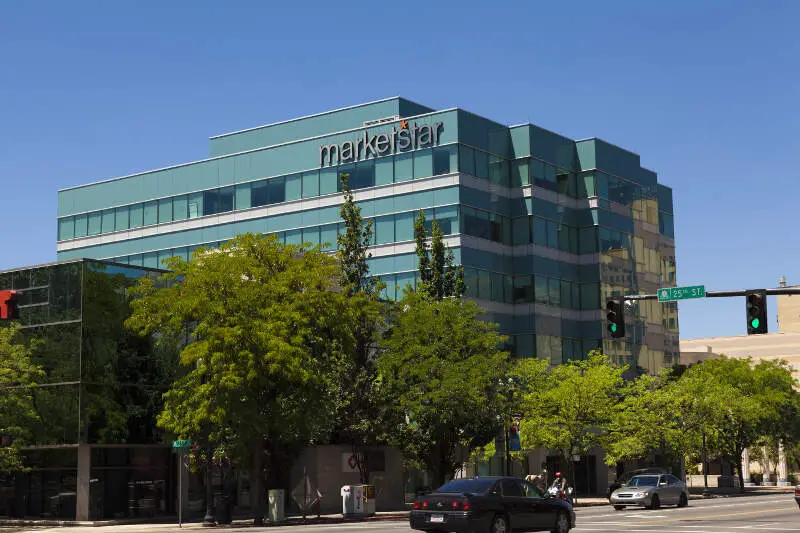
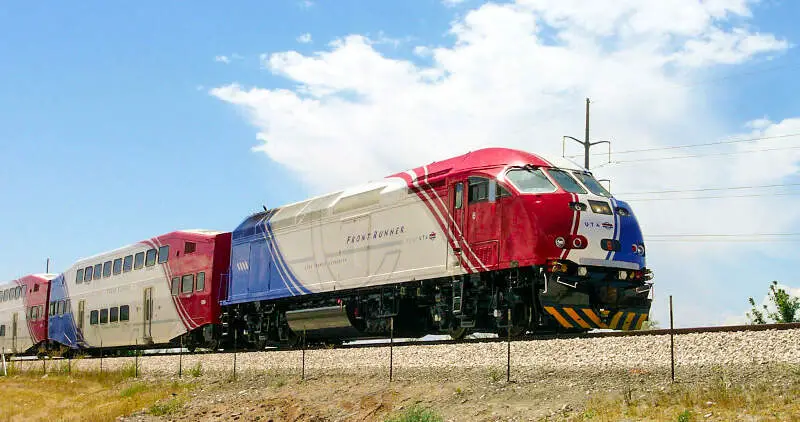
Ogden, UT Photos


Rankings & Articles For Ogden


Locations Around Ogden
Map Of Ogden, UT
Best Places Around Ogden
Fruit Heights, UT
Population 6,023
Kaysville, UT
Population 33,053
Farmington, UT
Population 25,389
Syracuse, UT
Population 35,488
South Weber, UT
Population 8,115
Pleasant View, UT
Population 11,217
Farr West, UT
Population 7,952
West Point, UT
Population 11,929
North Ogden, UT
Population 21,947
Clinton, UT
Population 23,612
Ogden Demographics And Statistics
Population over time in Ogden
The current population in Ogden is 87,413. The population has increased 7.8% from 2010.
| Year | Population | % Change |
|---|---|---|
| 2024 | 87,413 | 0.5% |
| 2023 | 86,973 | 0.3% |
| 2022 | 86,754 | 0.7% |
| 2021 | 86,110 | -1.2% |
| 2020 | 87,175 | 0.4% |
| 2019 | 86,833 | 0.8% |
| 2018 | 86,126 | 0.7% |
| 2017 | 85,497 | 0.7% |
| 2016 | 84,900 | 0.7% |
| 2015 | 84,273 | 0.6% |
| 2014 | 83,767 | 0.5% |
| 2013 | 83,363 | 0.7% |
| 2012 | 82,749 | 0.8% |
| 2011 | 82,118 | 1.3% |
| 2010 | 81,054 | - |
Race / Ethnicity in Ogden
See the full breakdown
Ogden is:
61.2% White with 53,457 White residents.
1.8% African American with 1,550 African American residents.
0.4% American Indian with 383 American Indian residents.
1.4% Asian with 1,187 Asian residents.
0.2% Hawaiian with 197 Hawaiian residents.
0.3% Other with 302 Other residents.
3.6% Two Or More with 3,137 Two Or More residents.
31.1% Hispanic with 27,200 Hispanic residents.
| Race | Ogden | UT | USA |
|---|---|---|---|
| White | 61.2% | 74.7% | 57.4% |
| African American | 1.8% | 1.1% | 11.9% |
| American Indian | 0.4% | 0.6% | 0.5% |
| Asian | 1.4% | 2.4% | 5.9% |
| Hawaiian | 0.2% | 0.9% | 0.2% |
| Other | 0.3% | 0.4% | 0.6% |
| Two Or More | 3.6% | 4.0% | 4.3% |
| Hispanic | 31.1% | 15.9% | 19.3% |
Gender in Ogden
See the full breakdown
Ogden is 46.9% female with 41,029 female residents.
Ogden is 53.1% male with 46,383 male residents.
| Gender | Ogden | UT | USA |
|---|---|---|---|
| Female | 46.9% | 49.3% | 50.5% |
| Male | 53.1% | 50.7% | 49.5% |
Highest level of educational attainment in Ogden for adults over 25
See the full breakdown
6.0% of adults in Ogden completed < 9th grade.
7.0% of adults in Ogden completed 9-12th grade.
27.0% of adults in Ogden completed high school / ged.
24.0% of adults in Ogden completed some college.
10.0% of adults in Ogden completed associate's degree.
18.0% of adults in Ogden completed bachelor's degree.
6.0% of adults in Ogden completed master's degree.
1.0% of adults in Ogden completed professional degree.
1.0% of adults in Ogden completed doctorate degree.
| Education | Ogden | UT | USA |
|---|---|---|---|
| < 9th Grade | 6.0% | 2.0% | 4.0% |
| 9-12th Grade | 7.0% | 4.0% | 6.0% |
| High School / GED | 27.0% | 22.0% | 26.0% |
| Some College | 24.0% | 23.0% | 19.0% |
| Associate's Degree | 10.0% | 10.0% | 9.0% |
| Bachelor's Degree | 18.0% | 25.0% | 22.0% |
| Master's Degree | 6.0% | 10.0% | 10.0% |
| Professional Degree | 1.0% | 2.0% | 2.0% |
| Doctorate Degree | 1.0% | 2.0% | 2.0% |
Household Income For Ogden, Utah
See the full breakdown
5.3% of households in Ogden earn Less than $10,000.
3.0% of households in Ogden earn $10,000 to $14,999.
6.1% of households in Ogden earn $15,000 to $24,999.
7.3% of households in Ogden earn $25,000 to $34,999.
10.9% of households in Ogden earn $35,000 to $49,999.
19.5% of households in Ogden earn $50,000 to $74,999.
15.5% of households in Ogden earn $75,000 to $99,999.
18.4% of households in Ogden earn $100,000 to $149,999.
7.8% of households in Ogden earn $150,000 to $199,999.
6.3% of households in Ogden earn $200,000 or more.
| Income | Ogden | UT | USA |
|---|---|---|---|
| Less than $10,000 | 5.3% | 3.1% | 5.0% |
| $10,000 to $14,999 | 3.0% | 2.0% | 3.4% |
| $15,000 to $24,999 | 6.1% | 4.0% | 6.3% |
| $25,000 to $34,999 | 7.3% | 5.0% | 6.6% |
| $35,000 to $49,999 | 10.9% | 8.8% | 10.1% |
| $50,000 to $74,999 | 19.5% | 15.5% | 15.5% |
| $75,000 to $99,999 | 15.5% | 14.2% | 12.6% |
| $100,000 to $149,999 | 18.4% | 21.6% | 17.5% |
| $150,000 to $199,999 | 7.8% | 11.9% | 9.6% |
| $200,000 or more | 6.3% | 13.9% | 13.4% |
Source: U.S. Census ACS 5-year estimates (2024)


