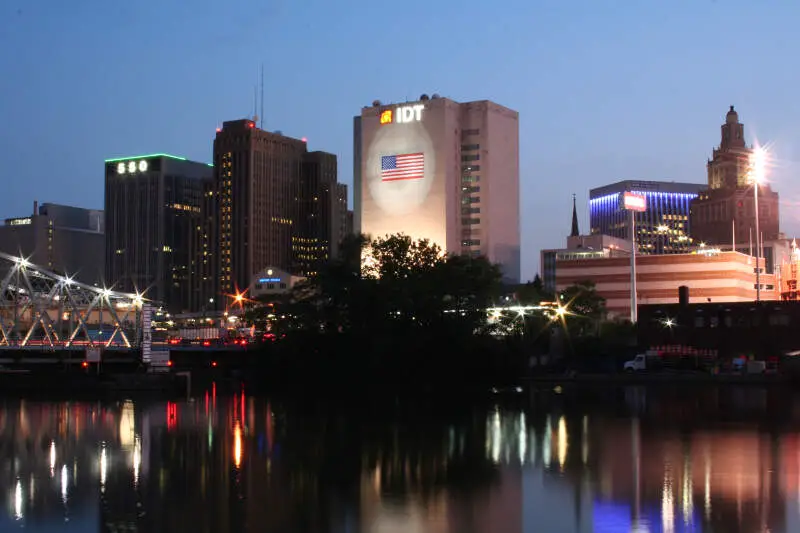
Newark’s neighborhoods conjure up too many stereotypes to count. You’ve got hipster areas, preppy places, neighborhoods where college kids thrive, and of course, ghettos.
It seems as if there’s a neighborhood for everyone in Newark.
And while the city consistently ranks as one of the best places to live in New Jersey thanks in part to tons of entertainment and jobs, it’s not all rainbows and sunshine in Newark. Some neighborhoods aren’t as safe as others.
So the question arises, which Newark neighborhoods are the most dangerous and which are the safest?
Today, we’ll use Saturday Night Science to determine which Newark hoods need a little tender loving care – the sore thumbs of the Newark area if you will. Realistically, you can’t expect all the neighborhoods to be amazing, although North Ironbound ranks way above the rest.
We examined 20 of Newark’s neighborhoods to find out the most dangerous places to live. These places don’t quite measure up to Newark’s reputation.
Table Of Contents: Top 10 | Methodology | Summary | Table
So what’s the worst neighborhood to live in Newark for 2025? According to the most recent census data, Dayton-Weequahic Park looks to be the worst neighborhood in Newark.
Read on to see how we determined the places around Newark that need a pick-me-up. And remember, don’t blame the messenger.
For more New Jersey reading, check out:
- Best Places To Live In New Jersey
- Cheapest Places To Live In New Jersey
- Most Dangerous Cities In New Jersey
The 10 Most Dangerous Neighborhoods In Newark For 2025
/10
Population: 2,788
Violent Crimes Per 100k: 701
Property Crime Per 100k: 3,180
Median Home Value: $87,600 (2nd worst)
Median Income: $23,837 (worst)
More on Dayton-Weequahic Park: Data
/10
Population: 12,462
Violent Crimes Per 100k: 743
Property Crime Per 100k: 3,370
Median Home Value: $75,687 (worst)
Median Income: $24,967 (2nd worst)
More on Springfield-Belmont: Data
/10
Population: 11,776
Violent Crimes Per 100k: 693
Property Crime Per 100k: 3,144
Median Home Value: $106,406 (3rd worst)
Median Income: $28,311 (3rd worst)
More on South Broad Street: Data
/10
Population: 2,585
Violent Crimes Per 100k: 643
Property Crime Per 100k: 2,918
Median Home Value: $131,567 (5th worst)
Median Income: $32,357 (8th worst)
More on Lower Clinton Hill: Data
/10
Population: 13,679
Violent Crimes Per 100k: 656
Property Crime Per 100k: 2,974
Median Home Value: $149,623 (8th worst)
Median Income: $29,552 (4th worst)
More on West Side: Data
/10
Population: 9,940
Violent Crimes Per 100k: 685
Property Crime Per 100k: 3,106
Median Home Value: $137,489 (6th worst)
Median Income: $29,909 (5th worst)
More on Lower Roseville: Data
/10
Population: 12,363
Violent Crimes Per 100k: 638
Property Crime Per 100k: 2,894
Median Home Value: $161,000 (10th worst)
Median Income: $30,315 (6th worst)
More on Fairmuont: Data
/10
Population: 10,536
Violent Crimes Per 100k: 645
Property Crime Per 100k: 2,927
Median Home Value: $151,667 (9th worst)
Median Income: $32,132 (7th worst)
More on Seventh Avenue: Data
/10
Population: 7,187
Violent Crimes Per 100k: 639
Property Crime Per 100k: 2,900
Median Home Value: $164,700 (11th worst)
Median Income: $33,803 (11th worst)
More on Mount Pleasant: Data
/10
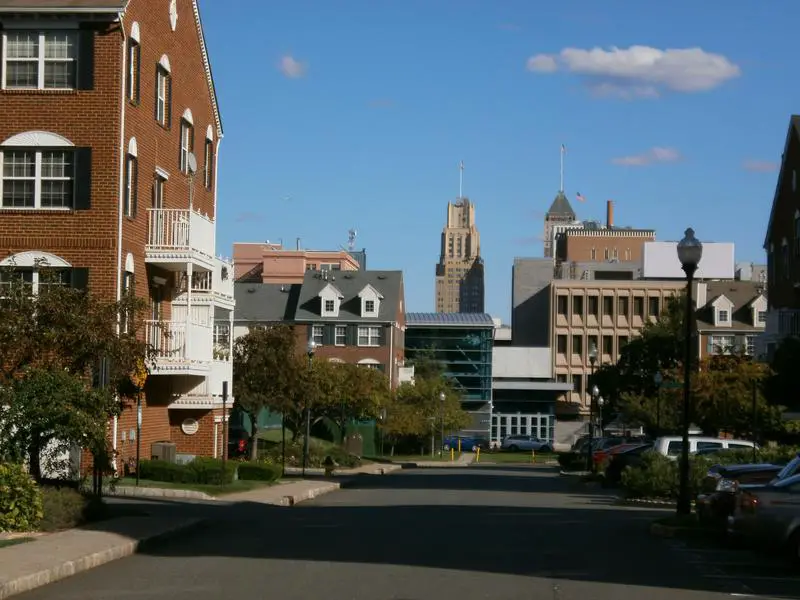
Population: 9,646
Violent Crimes Per 100k: 641
Property Crime Per 100k: 2,907
Median Home Value: $146,370 (7th worst)
Median Income: $36,350 (12th worst)
More on University Heights: Data
Methodology: How we determined the most dangerous Newark neighborhoods in 2025
To figure out how bad a place is to live in, we only needed to know what kinds of things people like and then decide what places have the least amount of those things. We plugged the following criteria into Saturday Night Science to get the worst neighborhoods in Newark:
- High crime (Estimated)
- High unemployment (Less jobs)
- Low median income (Less pay)
- Low population density (No things to do)
- Low home values (No one’s willing to pay to live here)
Then, we ranked each neighborhood in Newark, New Jersey for each of these criteria from worst to best.
Next, we averaged the individual rankings for each criterion into a “Worst Score.”
The neighborhood with the lowest “Worst Score” ranks as the most dangerous neighborhood of Newark.
The article is an opinion based on facts and is meant as infotainment. We updated this article for 2025. This report is our time ranking the worst neighborhoods to live in Newark.
Skip to the end to see the list of all 20 neighborhoods ranked from worst to best.
Summary: The Worst Neighborhoods Around Newark
Well, there you have it — the worst of the neighborhoods in Newark with Dayton-Weequahic Park landing at the bottom of the pack.
The worst neighborhoods in Newark are Dayton-Weequahic Park, Springfield-Belmont, South Broad Street, Lower Clinton Hill, West Side, Lower Roseville, Fairmuont, Seventh Avenue, Mount Pleasant, and University Heights.
As mentioned earlier, the neighborhoods in Newark aren’t all bad. North Ironbound takes the cake as the best place to live in Newark.
The best neighborhoods in Newark are North Ironbound, Upper Vailsburg, Weequahic, South Ironbound, and Upper Clinton Hill.
We ranked the neighborhoods from worst to best in the chart below.
For more New Jersey reading, check out:
Most Dangerous Neighborhoods To Live In Newark For 2025?
| Rank | Neighborhood | Population | Home Value | Median Income |
|---|---|---|---|---|
| 1 | Dayton-Weequahic Park | 2,788 | $87,600 | $23,837 |
| 2 | Springfield-Belmont | 12,462 | $75,687 | $24,967 |
| 3 | South Broad Street | 11,776 | $106,406 | $28,311 |
| 4 | Lower Clinton Hill | 2,585 | $131,567 | $32,357 |
| 5 | West Side | 13,679 | $149,623 | $29,552 |
| 6 | Lower Roseville | 9,940 | $137,489 | $29,909 |
| 7 | Fairmuont | 12,363 | $161,000 | $30,315 |
| 8 | Seventh Avenue | 10,536 | $151,667 | $32,132 |
| 9 | Mount Pleasant | 7,187 | $164,700 | $33,803 |
| 10 | University Heights | 9,646 | $146,370 | $36,350 |
| 11 | Central Business District | 5,389 | $129,883 | $42,834 |
| 12 | North Broadway | 10,921 | $221,443 | $33,740 |
| 13 | Forest Hill | 22,701 | $210,724 | $33,687 |
| 14 | Upper Roseville | 17,368 | $214,031 | $36,765 |
| 15 | Lower Vailsburg | 17,181 | $180,792 | $49,386 |
| 16 | Upper Clinton Hill | 16,214 | $227,408 | $38,308 |
| 17 | South Ironbound | 8,225 | $258,362 | $43,950 |
| 18 | Weequahic | 20,316 | $240,015 | $46,308 |
| 19 | Upper Vailsburg | 16,780 | $232,478 | $50,730 |
| 20 | North Ironbound | 43,436 | $220,131 | $45,242 |