Compare Newark to…
Newark SnackAbility
Overall SnackAbility
Crime in Newark summary. We use data from the FBI to determine the crime rates in Newark. Key points include:
There were 7,862 total crimes in Newark in the last reporting year.
The overall crime rate per 100,000 people in Newark is 2,538.5 / 100k people.
The violent crime rate per 100,000 people in Newark is 581.2 / 100k people.
The property crime rate per 100,000 people in Newark is 1,957.3 / 100k people.
Overall, crime in Newark is 19.78% above the national average.
Total Crimes
Above National Average
Crime In Newark Comparison Table
| Statistic | Count Raw |
Newark / 100k People |
New Jersey / 100k People |
National / 100k People |
|---|---|---|---|---|
| Total Crimes Per 100K | 7,862 | 2,538.5 | 1,645.1 | 2,119.2 |
| Violent Crime | 1,800 | 581.2 | 217.7 | 359.0 |
| Murder | 39 | 12.6 | 2.3 | 5.0 |
| Robbery | 442 | 142.7 | 49.3 | 61.0 |
| Aggravated Assault | 1,193 | 385.2 | 148.8 | 256.0 |
| Property Crime | 6,062 | 1,957.3 | 1,427.3 | 1,760.0 |
| Burglary | 472 | 152.4 | 145.3 | 229.0 |
| Larceny | 2,884 | 931.2 | 1,119.4 | 1,272.0 |
| Car Theft | 2,706 | 873.7 | 162.6 | 259.0 |
Source: FBI Uniform Crime Reporting (2024)
Cost of living in Newark summary. We use data on the cost of living to determine how expensive it is to live in Newark. Real estate prices drive most of the variance in cost of living around New Jersey. Key points include:
The cost of living in Newark is 121 with 100 being average.
The cost of living in Newark is 1.2x higher than the national average.
The median home value in Newark is $478,454.
The median income in Newark is $52,060.
Newark's Overall Cost Of Living
Higher Than The National Average
Cost Of Living In Newark Comparison Table
| Living Expense | Newark | New Jersey | National Average |
|---|---|---|---|
| Overall | 121 | 125 | 100 |
| Services | 106 | 107 | 100 |
| Groceries | 110 | 113 | 100 |
| Health | 135 | 155 | 100 |
| Housing | 119 | 116 | 100 |
| Transportation | 110 | 112 | 100 |
| Utilities | 117 | 113 | 100 |
Source: Cost of living index, normalized to US average = 100
Newark, NJ Weather
The average high in Newark is 63.2° and the average low is 45.1°.
There are 74.9 days of precipitation each year.
Expect an average of 48.1 inches of precipitation each year with 26.2 inches of snow.
| Stat | Newark |
|---|---|
| Average Annual High | 63.2 |
| Average Annual Low | 45.1 |
| Annual Precipitation Days | 74.9 |
| Average Annual Precipitation | 48.1 |
| Average Annual Snowfall | 26.2 |
Average High
Days of Rain
Source: NOAA climate normals (30-year)
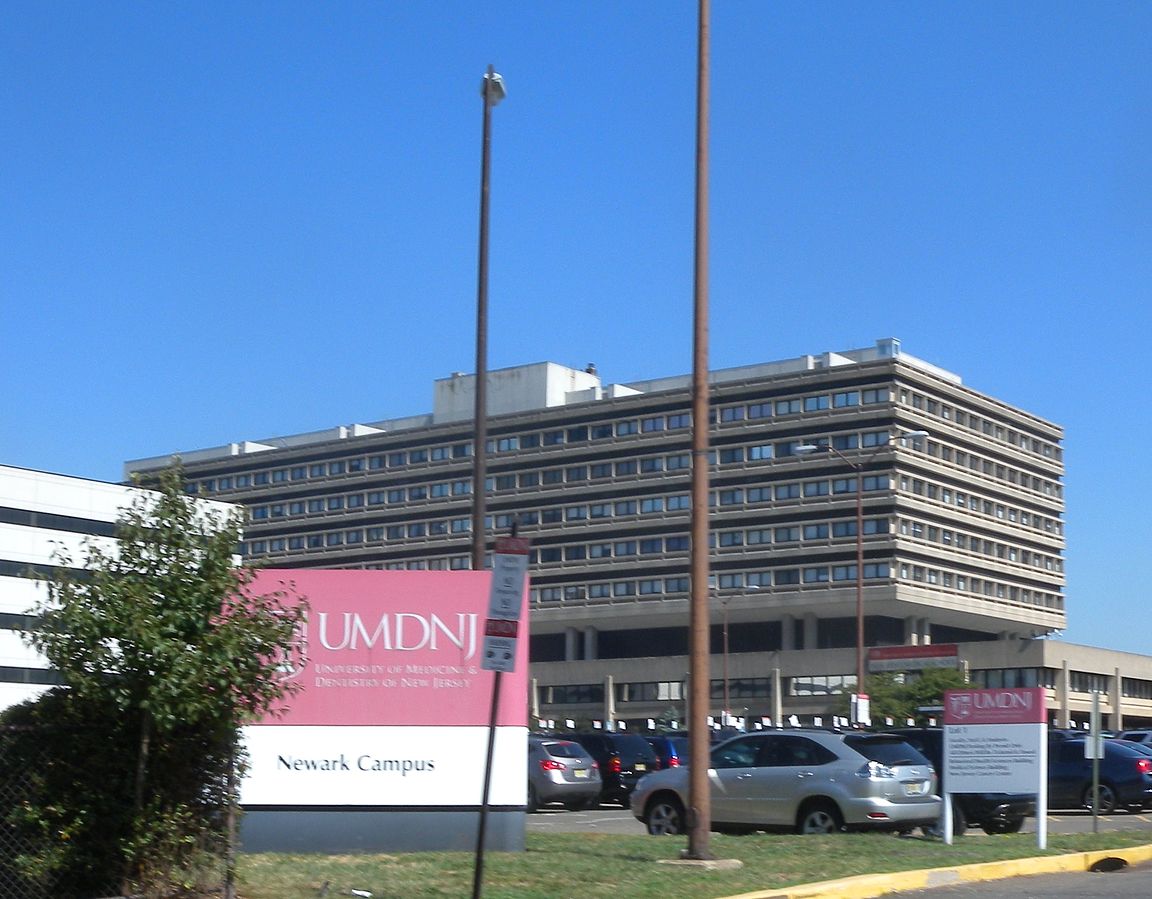
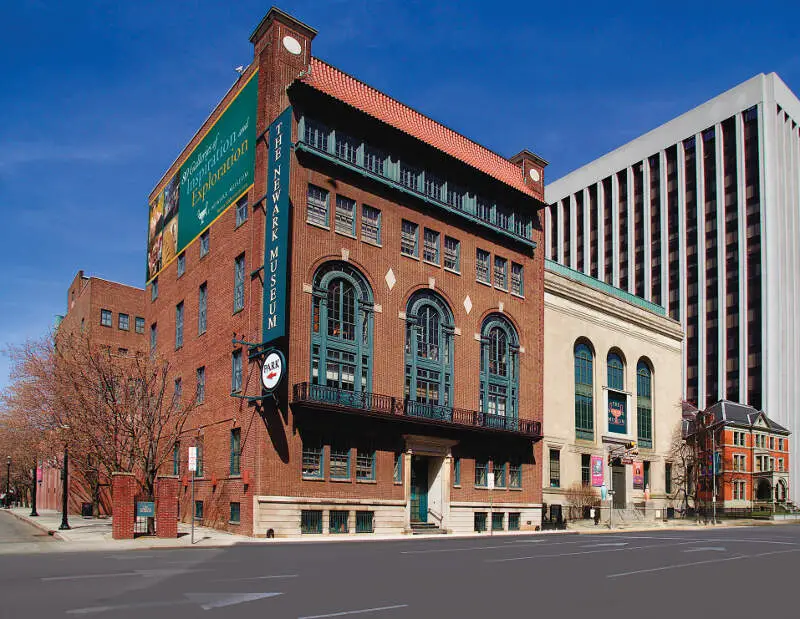
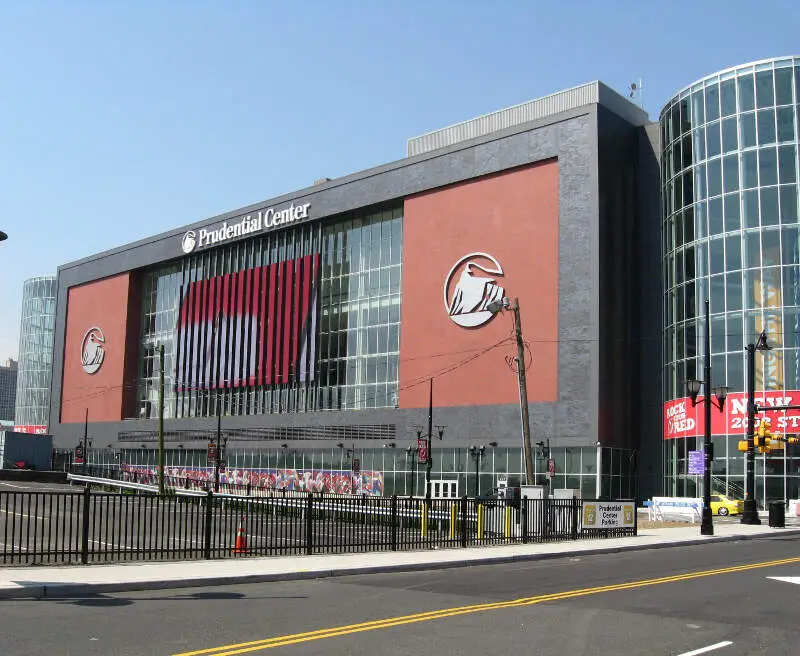
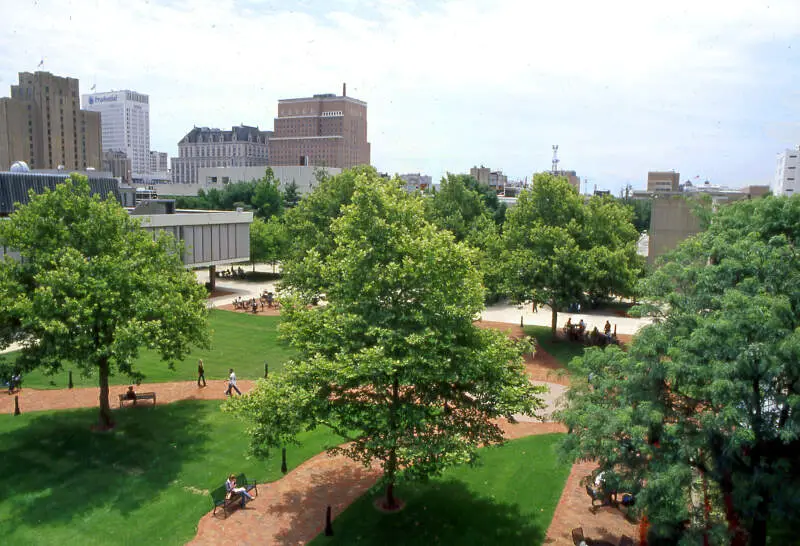
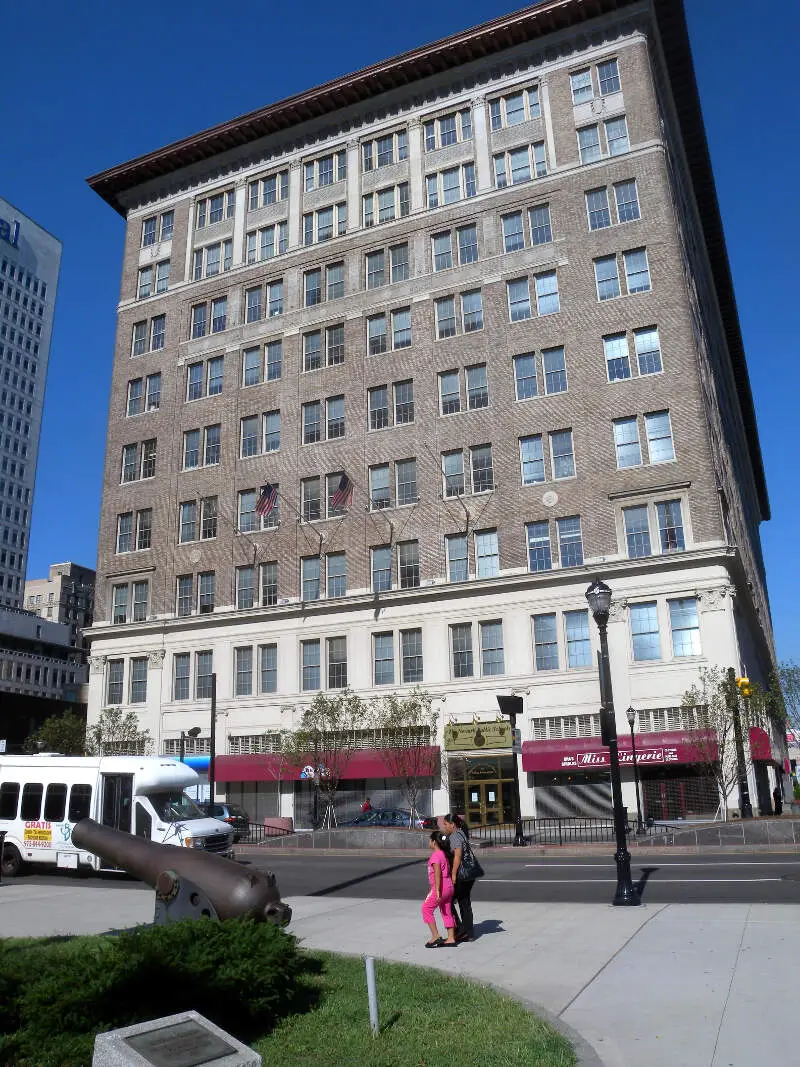
Newark, NJ Photos


7 Reviews & Comments About Newark

I've lived in Newark for 4 years now. This city has gotten a lot better than when I first came here. Lots of building going on here. Lots of houses being renovated here. Warrant squads are out and doing there thing. Many places where there were people hanging out on the street have been cleaned up. Many working people are moving here from NYC because of the much lower rents. People are buying houses here and are easy to obtain just as long as you have a good credit score, like 620 and up and you can show a work history of at least 2 - 3 years. Lots of businesses are moving into Newark now creating jobs. East Orange, Elizabeth, Union, Paterson and other cities are all being built up and the same thing that is happening here and happened in Jersey City and Hoboken is going on. New Jersey is making a come back.
So I lived in Newark basically my whole entire life and what I have to say from experience living here is that Newark does deserve to go on that list but not as #2 on the list because there are some bad parts and some good parts I live in the southern part of Newark which we call the Ironbound section of Newark and it is a wonderful place to live in there are many parks and schools and easy to travel to New York City. The bad parts of Newark where there is crime is the north and not to be racist or mean but that part houses ghetto people and i go to school in that area I am afraid of even walking home but once I reach the Ironbound I walk freely and in peace. This is just my point of view of Newark.
I live in Newark. Plus Newark is not bad at all
Plenty of colleges in and around Newark, our newspapers and emails are currently spammed about the student that got robbed, mugged, or murdered recently. Pretty gross city overall, drivers in the area are morons.
Avoid Newark NJ at all costs. No redeeming qualities.
there are no crimes and it has a very pleasant atmosphere and it also has a school and the local governance is good
liberty state park is my favorite place to hang out and new port is the best area to visit
I stopped in the city because I was driving to New York. The city is like a tremble, very old and people are not so nice. I went to a convenient store and everyone was looking at me weird because I was probably in the wrong neighborhood. I felt very unwelcome, therefore I decided to drive off and not stay in a hotel there.
There was no good thing about this town. Everything looked destroyed. The stores were so old and most gas stations smelled like pee. The whole neighborhood had shady people. I would not recommend staying at this place.
There are schools, colleges and several indian stores.
Niagra is my favourite place. It is awesome
Rankings & Articles For Newark


Locations Around Newark
Map Of Newark, NJ
Best Places Around Newark
Lincoln Park, NJ
Population 10,957
Florham Park, NJ
Population 13,564
Hasbrouck Heights, NJ
Population 12,115
Glen Rock, NJ
Population 12,154
Westfield, NJ
Population 31,111
Oradell, NJ
Population 8,235
Boonton, NJ
Population 8,854
Midland Park, NJ
Population 7,019
Franklin Lakes, NJ
Population 11,084
Wood-Ridge, NJ
Population 10,218
Newark Demographics And Statistics
Population over time in Newark
The current population in Newark is 310,178. The population has increased 12.9% from 2010.
| Year | Population | % Change |
|---|---|---|
| 2024 | 310,178 | 1.0% |
| 2023 | 307,188 | -0.1% |
| 2022 | 307,355 | 0.4% |
| 2021 | 306,247 | 8.6% |
| 2020 | 281,917 | 0.3% |
| 2019 | 281,054 | 0.2% |
| 2018 | 280,463 | -0.8% |
| 2017 | 282,803 | 1.0% |
| 2016 | 280,139 | 0.1% |
| 2015 | 279,793 | 0.4% |
| 2014 | 278,750 | 0.5% |
| 2013 | 277,357 | 0.3% |
| 2012 | 276,478 | 0.4% |
| 2011 | 275,512 | 0.3% |
| 2010 | 274,674 | - |
Race / Ethnicity in Newark
See the full breakdown
Newark is:
8.9% White with 27,605 White residents.
44.8% African American with 138,868 African American residents.
0.1% American Indian with 454 American Indian residents.
2.0% Asian with 6,093 Asian residents.
0.0% Hawaiian with 102 Hawaiian residents.
2.5% Other with 7,700 Other residents.
4.1% Two Or More with 12,762 Two Or More residents.
37.6% Hispanic with 116,594 Hispanic residents.
| Race | Newark | NJ | USA |
|---|---|---|---|
| White | 8.9% | 50.9% | 57.4% |
| African American | 44.8% | 12.2% | 11.9% |
| American Indian | 0.1% | 0.1% | 0.5% |
| Asian | 2.0% | 10.0% | 5.9% |
| Hawaiian | 0.0% | 0.0% | 0.2% |
| Other | 2.5% | 0.8% | 0.6% |
| Two Or More | 4.1% | 3.5% | 4.3% |
| Hispanic | 37.6% | 22.5% | 19.3% |
Gender in Newark
See the full breakdown
Newark is 50.7% female with 157,269 female residents.
Newark is 49.3% male with 152,909 male residents.
| Gender | Newark | NJ | USA |
|---|---|---|---|
| Female | 50.7% | 50.8% | 50.5% |
| Male | 49.3% | 49.2% | 49.5% |
Highest level of educational attainment in Newark for adults over 25
See the full breakdown
11.0% of adults in Newark completed < 9th grade.
10.0% of adults in Newark completed 9-12th grade.
37.0% of adults in Newark completed high school / ged.
16.0% of adults in Newark completed some college.
6.0% of adults in Newark completed associate's degree.
13.0% of adults in Newark completed bachelor's degree.
5.0% of adults in Newark completed master's degree.
1.0% of adults in Newark completed professional degree.
1.0% of adults in Newark completed doctorate degree.
| Education | Newark | NJ | USA |
|---|---|---|---|
| < 9th Grade | 11.0% | 4.0% | 4.0% |
| 9-12th Grade | 10.0% | 5.0% | 6.0% |
| High School / GED | 37.0% | 25.0% | 26.0% |
| Some College | 16.0% | 15.0% | 19.0% |
| Associate's Degree | 6.0% | 7.0% | 9.0% |
| Bachelor's Degree | 13.0% | 26.0% | 22.0% |
| Master's Degree | 5.0% | 13.0% | 10.0% |
| Professional Degree | 1.0% | 3.0% | 2.0% |
| Doctorate Degree | 1.0% | 2.0% | 2.0% |
Household Income For Newark, New Jersey
See the full breakdown
10.7% of households in Newark earn Less than $10,000.
7.2% of households in Newark earn $10,000 to $14,999.
9.3% of households in Newark earn $15,000 to $24,999.
8.1% of households in Newark earn $25,000 to $34,999.
12.6% of households in Newark earn $35,000 to $49,999.
17.9% of households in Newark earn $50,000 to $74,999.
10.7% of households in Newark earn $75,000 to $99,999.
13.4% of households in Newark earn $100,000 to $149,999.
5.0% of households in Newark earn $150,000 to $199,999.
5.0% of households in Newark earn $200,000 or more.
| Income | Newark | NJ | USA |
|---|---|---|---|
| Less than $10,000 | 10.7% | 4.1% | 5.0% |
| $10,000 to $14,999 | 7.2% | 2.7% | 3.4% |
| $15,000 to $24,999 | 9.3% | 4.8% | 6.3% |
| $25,000 to $34,999 | 8.1% | 5.1% | 6.6% |
| $35,000 to $49,999 | 12.6% | 7.6% | 10.1% |
| $50,000 to $74,999 | 17.9% | 12.8% | 15.5% |
| $75,000 to $99,999 | 10.7% | 11.3% | 12.6% |
| $100,000 to $149,999 | 13.4% | 18.1% | 17.5% |
| $150,000 to $199,999 | 5.0% | 11.8% | 9.6% |
| $200,000 or more | 5.0% | 21.6% | 13.4% |
Source: U.S. Census ACS 5-year estimates (2024)


