Most Americans have never been to small town Connecticut. However, as the Connecticuter who live there know, small town Connecticut is an awesome place to call home.
But is it all roses? Definitely not. Just like any other state, Connecticut has its trouble spots. This article aims to determine, using Saturday Night Science, the absolute worst small towns to live in the Constitution State. Don’t freak out, we will use data to show which places have high crime, poverty, and unemployment.
After analyzing more than 66 of Connecticut’s smallest cities, we came up with this list as the 10 worst small towns in Connecticut where you’d never want to live:
12.6% unemployment · $1,000 median income
7.2% unemployment · $54,375 median income
6.9% unemployment · $75,045 median income
17.1% unemployment · $64,050 median income
Data | Crime | Cost of living | Movers
3.4% unemployment · $68,958 median income
22.4% unemployment · $36,940 median income
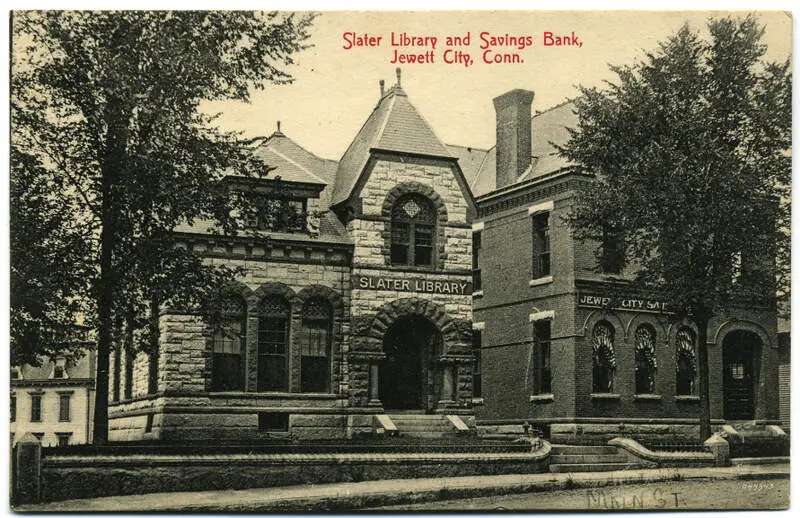
5.3% unemployment · $55,530 median income
Data | Crime | Cost of living | Movers
4.3% unemployment · $69,167 median income
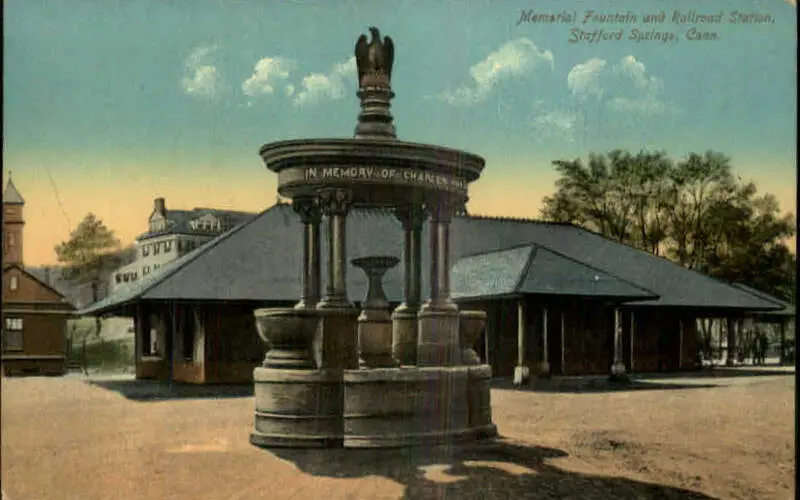
4.8% unemployment · $59,028 median income
Data | Movers
3.9% unemployment · $63,512 median income
The receipts
Compare the top ten
Pick a metric. The bars rescale. The red line is Connecticut’s statewide median.
Connecticut statewide median: $436,407
Connecticut statewide median: $95,781
Connecticut statewide median: 5.6%
On the map
Where Connecticut’s worst small towns are
Saturday Night Science
Methodology: How do you decide if a small place in Connecticut is lousy or not?
To rank the worst small towns to live in Connecticut, we had to determine what criteria people like or dislike about a place. Assuming that people like low crime, solid education, things to do, and a stable economy isn’t a stretch.
We then analyzed the criteria using Saturday Night Science, the thinking you’d use at a bar. It seems like even your crazy Uncle would agree that a town with high crime is worse than a town with low crime; all else the same.
Using FBI crime data and the Census’s 2020-2024 American Community Survey, this is the criteria we used:
- Population Density (The lower, the worse)
- Highest Unemployment Rates
- Low housing costs (meaning there’s no demand)
- Adjusted Median Income (Median income adjusted for the cost of living)
- Education (Number of high school dropouts)
- High Crime
We looked at cities with populations between 1,000 and 5,000 people, of which there were many – 66 to be exact.
We get the crime numbers from the FBI, which gets them from the cities. Dropout numbers are based on the adult population, not just the current graduation rates of teenagers.
We base all our research on facts, which is meant as infotainment. We updated this article for 2026, which is our eleventh time ranking the worst small places to live in Connecticut.
The full plate
Worst Small Towns In Connecticut
Click any column to sort. Search by town name.
| Rank | Town | Population | Unemployment Rate | Home Value | Median Income |
|---|---|---|---|---|---|
| 1 | North Grosvenor Dale | 1,212 | 12.6% | $338,278 | $1,000 |
| 2 | Plainfield Village | 2,316 | 7.2% | $276,665 | $54,375 |
| 3 | South Windham | 1,281 | 6.9% | $285,645 | $75,045 |
| 4 | Danielson | 4,209 | 17.1% | $267,149 | $64,050 |
| 5 | Baltic | 1,157 | 3.4% | $233,369 | $68,958 |
| 6 | Poquonock Bridge | 1,105 | 22.4% | $262,035 | $36,940 |
| 7 | Jewett City | 3,429 | 5.3% | $234,202 | $55,530 |
| 8 | Oxoboxo River | 2,782 | 4.3% | $292,841 | $69,167 |
| 9 | Stafford Springs | 4,649 | 4.8% | $334,109 | $59,028 |
| 10 | Blue Hills | 1,676 | 3.9% | $281,779 | $63,512 |
| 11 | Coventry Lake | 2,647 | 6.4% | $312,467 | $73,224 |
| 12 | East Brooklyn | 2,377 | 10.3% | $351,362 | $73,698 |
| 13 | Gales Ferry | 1,141 | 6.0% | $398,583 | $80,735 |
| 14 | Deep River Center | 2,407 | 2.1% | $397,988 | $71,447 |
| 15 | New Preston | 1,146 | 5.9% | $681,436 | $76,406 |
| 16 | Quinebaug | 1,193 | 19.8% | $282,850 | $105,181 |
| 16 | Waterford | 3,304 | 6.2% | $417,642 | $73,156 |
| 18 | Broad Brook | 3,609 | 6.0% | $403,595 | $97,625 |
| 19 | Chester Center | 2,026 | 4.0% | $502,540 | $89,375 |
| 20 | New Hartford Center | 1,373 | 4.8% | $226,351 | $76,853 |
| 21 | Suffield Depot | 2,006 | 14.6% | $456,628 | $91,625 |
| 22 | Woodbury Center | 1,606 | 8.0% | $526,329 | $98,194 |
| 23 | Westbrook Center | 2,501 | 2.0% | $516,813 | $74,618 |
| 24 | Watertown | 3,897 | 2.3% | $381,343 | $103,200 |
| 25 | Northwest Harwinton | 3,088 | 4.1% | $393,111 | $109,458 |
| 26 | South Woodstock | 1,340 | 5.5% | $294,506 | $97,801 |
| 27 | Thomaston | 1,988 | 3.9% | $341,707 | $79,674 |
| 28 | Clinton | 3,465 | 7.8% | $452,128 | $102,750 |
| 29 | Heritage Village | 4,968 | 4.5% | $289,154 | $62,059 |
| 30 | Tariffville | 1,419 | 10.3% | $326,621 | $106,944 |
| 31 | Moodus | 2,042 | 2.3% | $339,824 | $103,457 |
| 32 | Moosup | 2,885 | 0.0% | $322,220 | $73,024 |
| 33 | Bethlehem Village | 2,195 | 2.6% | $452,583 | $109,256 |
| 34 | Byram | 4,633 | 11.4% | $997,230 | $99,734 |
| 35 | Colchester | 4,692 | 3.0% | $430,179 | $86,760 |
| 35 | Collinsville | 3,963 | 4.8% | $470,425 | $94,815 |
| 37 | Durham | 3,347 | 5.5% | $494,741 | $152,396 |
| 38 | Old Mystic | 3,340 | 3.2% | $407,385 | $130,903 |
| 39 | Wauregan | 1,049 | 2.7% | $312,467 | $79,545 |
| 40 | Lake Pocotopaug | 4,875 | 3.1% | $369,085 | $118,150 |
| 41 | Guilford Center | 2,263 | 3.4% | $692,732 | $82,273 |
| 41 | Somers | 2,056 | 4.9% | $461,689 | $68,779 |
| 43 | Litchfield | 1,251 | 6.5% | $524,585 | $109,773 |
| 44 | Higganum | 1,742 | 0.0% | $486,992 | $127,759 |
| 45 | South Coventry | 1,434 | 0.0% | $385,975 | $107,767 |
| 46 | Pemberwick | 3,665 | 2.1% | $1,118,315 | $132,326 |
| 47 | Salmon Brook | 2,343 | 0.0% | $386,213 | $74,375 |
| 48 | Georgetown | 1,932 | 7.1% | $940,137 | $181,364 |
| 49 | Crystal Lake | 2,024 | 0.0% | $430,341 | $143,882 |
| 50 | Old Saybrook Center | 1,659 | 0.0% | $554,400 | $93,875 |
| 51 | East Hampton | 3,347 | 1.5% | $419,506 | $123,929 |
| 52 | Ne | 1,898 | 3.3% | $622,317 | $164,821 |
| 53 | Wilton Center | 1,682 | 2.8% | $669,895 | $119,500 |
| 54 | Noank | 1,859 | 0.1% | $632,665 | $143,583 |
| 55 | Canton Valley | 1,186 | 0.0% | $383,834 | $91,678 |
| 56 | Glenville | 2,656 | 10.0% | $1,366,196 | $220,865 |
| 57 | Essex Village | 2,705 | 0.7% | $894,343 | $102,885 |
| 57 | Saybrook Manor | 1,358 | 2.6% | $697,014 | $119,670 |
| 59 | Niantic | 3,123 | 3.4% | $503,381 | $81,250 |
| 60 | Woodmont | 1,661 | 2.8% | $556,541 | $91,250 |
| 61 | Mystic | 4,483 | 2.9% | $640,872 | $152,559 |
| 62 | North Granby | 1,451 | 0.0% | $457,341 | $110,741 |
| 63 | Southport | 1,568 | 4.7% | $1,301,966 | $159,688 |
| 64 | Madison Center | 1,981 | 2.7% | $1,001,274 | $178,194 |
| 65 | West Simsbury | 3,000 | 0.8% | $598,409 | $201,397 |
| 66 | Weatogue | 2,672 | 2.9% | $514,791 | $163,714 |
Source: FBI crime data + U.S. Census ACS 2020-2024 via Saturday Night Science. 66 Connecticut towns between 1,000 and 5,000 residents.
Summary
There You Have It – The Worst Small Towns In Connecticut
If you’re analyzing teeny places in the Constitution State with the worst economic situations, where there’s high crime and there’s not a lot to do, this is an accurate list.
The worst small towns in Connecticut are North Grosvenor Dale, Plainfield Village, South Windham, Danielson, Baltic, Poquonock Bridge, Jewett City, Oxoboxo River, Stafford Springs, and Blue Hills. Not sold on Connecticut? Take the two-minute Find Your Place quiz and see which state actually fits you.