100 Biggest Cities In Connecticut For 2026
Using the latest Census data, we detail the 100 biggest cities in Connecticut. You can all see a comprehensive list of all 122 cities and places in Connecticut.

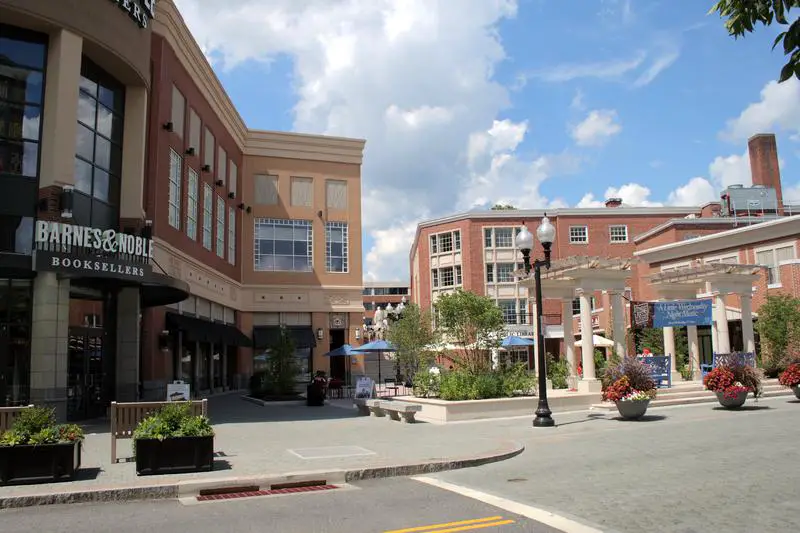
We all love the biggest cities that the Constitution State has to offer. You know the places like Bridgeport and Stamford which make all the headlines.
But there are a bunch of other great large cities in Connecticut that don't get as much love.
We're going to change that right now.
Using the most recent Census data, we can tell you about all the places in Connecticut with a focus on the biggest. We update the data each year and this is our fourth time doing this.
Table Of Contents: Top Ten | Methodology | Table
The Largest Cities In Connecticut For 2026:
You can click here to see a full table of the full of the 100 biggest cities in Connecticut, along with every other place over 1,000 people big. It is sortable by clicking on the headers.
Read on below to see more on the biggest cities. Or for more reading on places to live in Connecticut, check out:
- Best Places To Live In Connecticut
- Cheapest Places To Live In Connecticut
- Most Dangerous Cities In Connecticut
The 10 Biggest Cities In Connecticut

/10
Rank Last Year: 1 (No Change)
Population: 149,153.0
Population 2010: 142,576
Growth: 4.6%
More on Bridgeport: Data | Crime | Cost Of Living | Real Estate

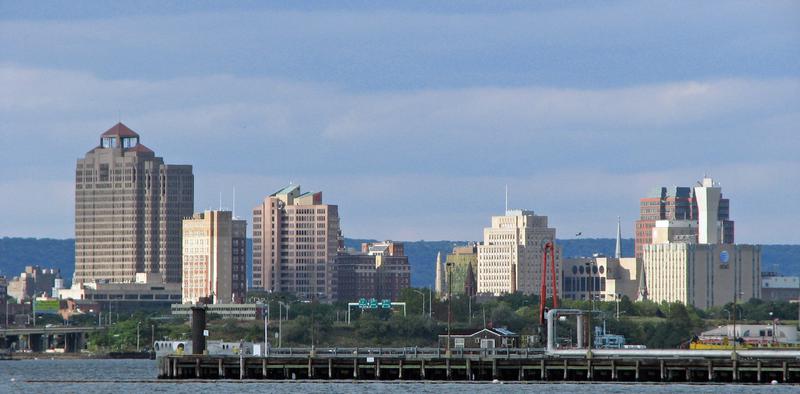
/10
Rank Last Year: 2 (No Change)
Population: 137,144.0
Population 2010: 120,907
Growth: 13.4%
More on Stamford: Data | Crime | Cost Of Living | Real Estate

/10
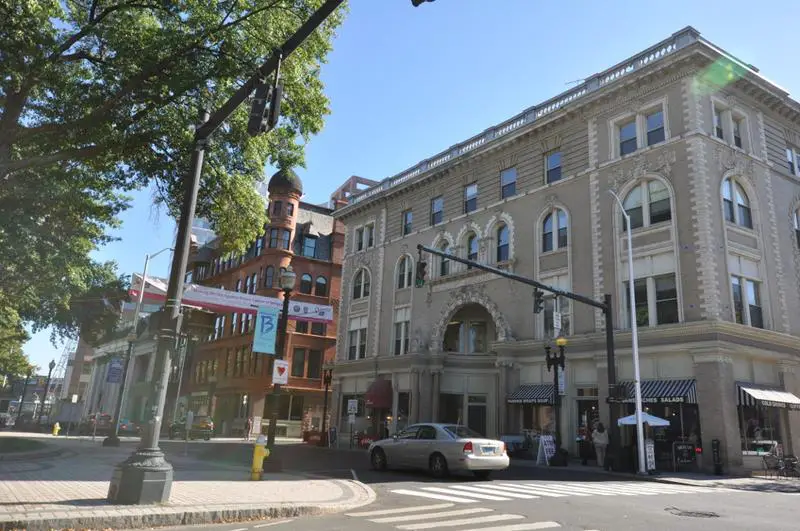
Rank Last Year: 3 (No Change)
Population: 134,349.0
Population 2010: 128,885
Growth: 4.2%
More on New Haven: Data | Crime | Cost Of Living | Real Estate

/10
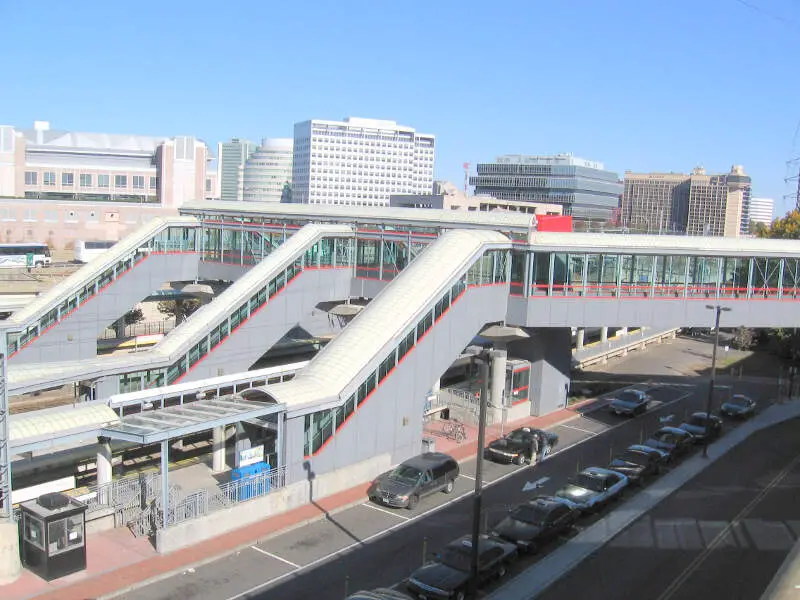
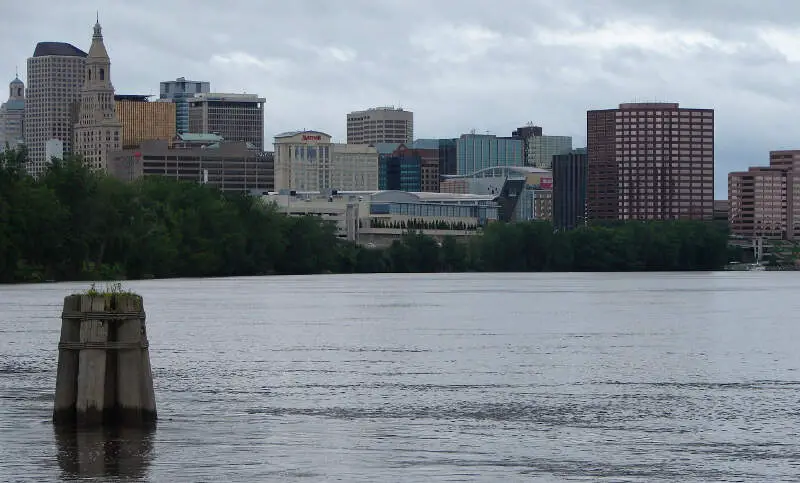
Rank Last Year: 4 (No Change)
Population: 121,127.0
Population 2010: 124,760
Growth: -2.9%
More on Hartford: Data | Crime | Cost Of Living | Real Estate

/10
Rank Last Year: 5 (No Change)
Population: 114,869.0
Population 2010: 109,941
Growth: 4.5%
More on Waterbury: Data | Crime | Cost Of Living | Real Estate

/10
Rank Last Year: 6 (No Change)
Population: 92,187.0
Population 2010: 84,611
Growth: 9.0%
More on Norwalk: Data | Crime | Cost Of Living | Real Estate

/10
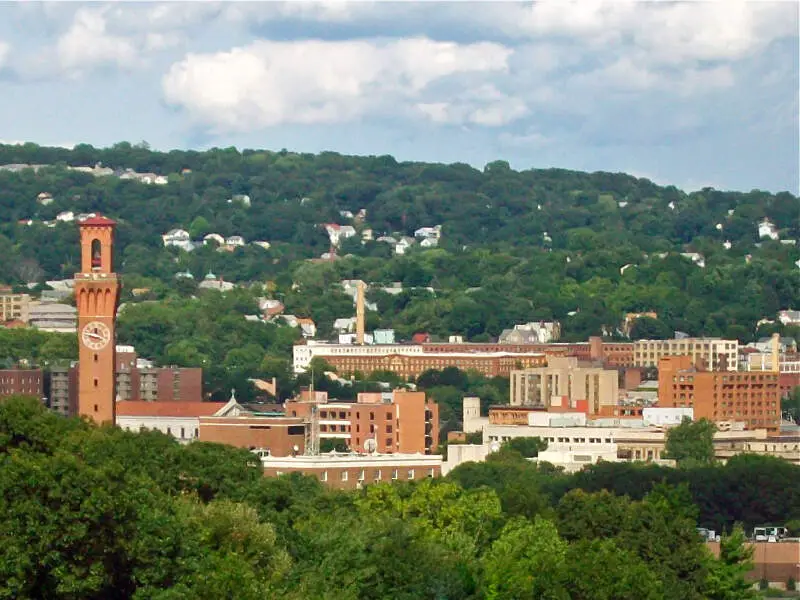
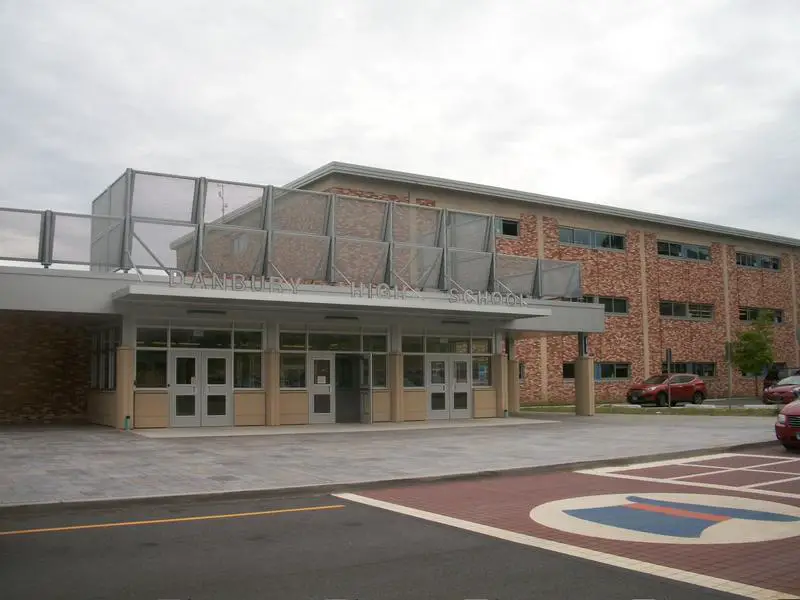
Rank Last Year: 7 (No Change)
Population: 87,263.0
Population 2010: 79,371
Growth: 9.9%
More on Danbury: Data | Crime | Cost Of Living | Real Estate

/10
Rank Last Year: 8 (No Change)
Population: 74,223.0
Population 2010: 72,954
Growth: 1.7%
More on New Britain: Data | Crime | Cost Of Living | Real Estate

/10
Rank Last Year: 9 (No Change)
Population: 63,620.0
Population 2010: 62,898
Growth: 1.1%
More on West Hartford: Data | Crime | Cost Of Living | Real Estate

/10
Rank Last Year: 10 (No Change)
Population: 61,462.0
Population 2010: 60,466
Growth: 1.6%
More on Bristol: Data | Crime | Cost Of Living | Real Estate
How We Determined The Largest Cities In Connecticut
We've been ranking and dissecting cities in the Constitution State for over 4 years now -- making this actually the fourth time we've run the numbers. We always use the best data, the US Census. In this case, that means we are using the American Community Survey.
It what is probably the most simple analysis we run each year, we ranked every place in Connecticut from biggest to smallest. The biggest city this year? That would be Bridgeport.
The smallest? Wauregan, although there are places smaller than 1,000 people not listed here, so keep that in mind as we take a look at the top ten.
Now on to numbers 11-100 Biggest in Connecticut
We hope that you find the big city, or really any city, that's right for you. Below is a list of the rest of the biggest cities along with every other place in Connecticut.
Have fun snacking around in the Constitution State!
For more reading on Connecticut, check out:
- Best Places To Raise A Family In Connecticut
- Best Places To Retire In Connecticut
- Richest Cities In Connecticut
- Safest Places In Connecticut
- Worst Places To Live In Connecticut
- Most Expensive Places To Live In Connecticut
Detailed List Of The Biggest Cities In Connecticut
| Rank | City | Current Population | 2010 | Growth | |||||
|---|---|---|---|---|---|---|---|---|---|
| 1 | Bridgeport | 149,153.0 | 142,576 | 4.6% | |||||
| 2 | Stamford | 137,144.0 | 120,907 | 13.4% | |||||
| 3 | New Haven | 134,349.0 | 128,885 | 4.2% | |||||
| 4 | Hartford | 121,127.0 | 124,760 | -2.9% | |||||
| 5 | Waterbury | 114,869.0 | 109,941 | 4.5% | |||||
| 6 | Norwalk | 92,187.0 | 84,611 | 9.0% | |||||
| 7 | Danbury | 87,263.0 | 79,371 | 9.9% | |||||
| 8 | New Britain | 74,223.0 | 72,954 | 1.7% | |||||
| 9 | West Hartford | 63,620.0 | 62,898 | 1.1% | |||||
| 10 | Bristol | 61,462.0 | 60,466 | 1.6% | |||||
| 11 | Meriden | 60,545.0 | 60,484 | 0.1% | |||||
| 12 | West Haven | 55,351.0 | 55,070 | 0.5% | |||||
| 13 | Milford | 51,023.0 | 51,019 | 0.0% | |||||
| 14 | East Hartford | 50,918.0 | 50,974 | -0.1% | |||||
| 15 | Middletown | 47,958.0 | 47,349 | 1.3% | |||||
| 16 | Shelton | 41,889.0 | 39,061 | 7.2% | |||||
| 17 | Norwich | 39,973.0 | 39,843 | 0.3% | |||||
| 18 | Manchester | 36,759.0 | 29,917 | 22.9% | |||||
| 19 | Torrington | 35,547.0 | 36,423 | -2.4% | |||||
| 20 | Naugatuck | 31,800.0 | 31,746 | 0.2% | |||||
| 21 | Newington | 30,896.0 | 30,361 | 1.8% | |||||
| 22 | East Haven | 27,806.0 | 29,074 | -4.4% | |||||
| 23 | New London | 27,625.0 | 27,496 | 0.5% | |||||
| 24 | Wethersfield | 27,250.0 | 26,613 | 2.4% | |||||
| 25 | North Haven | 24,336.0 | 23,927 | 1.7% | |||||
| 26 | Ansonia | 19,033.0 | 19,163 | -0.7% | |||||
| 27 | Wallingford Center | 18,208.0 | 17,947 | 1.5% | |||||
| 28 | Willimantic | 18,096.0 | 17,485 | 3.5% | |||||
| 29 | Storrs | 15,207.0 | 14,134 | 7.6% | |||||
| 30 | Greenwich | 14,792.0 | 13,271 | 11.5% | |||||
| 31 | Orange | 14,315.0 | 13,831 | 3.5% | |||||
| 32 | Windsor Locks | 12,579.0 | 12,419 | 1.3% | |||||
| 33 | Derby | 12,487.0 | 12,826 | -2.6% | |||||
| 34 | Bethel | 11,404.0 | 8,799 | 29.6% | |||||
| 35 | Kensington | 9,962.0 | 8,761 | 13.7% | |||||
| 36 | Groton | 9,490.0 | 10,225 | -7.2% | |||||
| 37 | Oakville | 9,276.0 | 9,381 | -1.1% | |||||
| 38 | Riverside | 8,954.0 | 8,413 | 6.4% | |||||
| 39 | New Milford | 8,188.0 | 6,437 | 27.2% | |||||
| 40 | Southwood Acres | 8,115.0 | 7,872 | 3.1% | |||||
| 41 | Thompsonville | 7,927.0 | 8,838 | -10.3% | |||||
| 42 | Cos Cob | 7,546.0 | 6,126 | 23.2% | |||||
| 43 | Glastonbury Center | 7,266.0 | 7,054 | 3.0% | |||||
| 44 | Putnam | 7,120.0 | 7,505 | -5.1% | |||||
| 45 | Rockville | 7,072.0 | 7,706 | -8.2% | |||||
| 46 | Winsted | 6,977.0 | 7,318 | -4.7% | |||||
| 47 | Ridgefield | 6,970.0 | 7,721 | -9.7% | |||||
| 48 | Old Greenwich | 6,936.0 | 6,568 | 5.6% | |||||
| 49 | Branford Center | 6,305.0 | 6,442 | -2.1% | |||||
| 50 | Simsbury Center | 6,198.0 | 6,006 | 3.2% | |||||
| 51 | Cheshire Village | 6,172.0 | 5,327 | 15.9% | |||||
| 52 | Hazardville | 6,022.0 | 4,796 | 25.6% | |||||
| 53 | Portland | 5,944.0 | 5,947 | -0.1% | |||||
| 54 | Sherwood Manor | 5,706.0 | 5,655 | 0.9% | |||||
| 55 | Pawcatuck | 5,577.0 | 5,802 | -3.9% | |||||
| 56 | Terryville | 5,461.0 | 5,133 | 6.4% | |||||
| 57 | Heritage Village | 4,968.0 | 3,431 | 44.8% | |||||
| 58 | Lake Pocotopaug | 4,875.0 | 2,849 | 71.1% | |||||
| 59 | Colchester | 4,692.0 | 4,680 | 0.3% | |||||
| 60 | Stafford Springs | 4,649.0 | 5,019 | -7.4% | |||||
| 61 | Byram | 4,633.0 | 4,614 | 0.4% | |||||
| 62 | Mystic | 4,483.0 | 3,959 | 13.2% | |||||
| 63 | Danielson | 4,209.0 | 4,136 | 1.8% | |||||
| 64 | Collinsville | 3,963.0 | 3,506 | 13.0% | |||||
| 65 | Watertown | 3,897.0 | 3,666 | 6.3% | |||||
| 66 | Pemberwick | 3,665.0 | 3,406 | 7.6% | |||||
| 67 | Broad Brook | 3,609.0 | 4,612 | -21.7% | |||||
| 68 | Clinton | 3,465.0 | 3,469 | -0.1% | |||||
| 69 | Jewett City | 3,429.0 | 3,415 | 0.4% | |||||
| 70 | Durham | 3,347.0 | 2,628 | 27.4% | |||||
| 71 | East Hampton | 3,347.0 | 2,576 | 29.9% | |||||
| 72 | Old Mystic | 3,340.0 | 3,696 | -9.6% | |||||
| 73 | Waterford | 3,304.0 | 2,707 | 22.1% | |||||
| 74 | Niantic | 3,123.0 | 2,933 | 6.5% | |||||
| 75 | Northwest Harwinton | 3,088.0 | 3,224 | -4.2% | |||||
| 76 | West Simsbury | 3,000.0 | 2,689 | 11.6% | |||||
| 77 | Moosup | 2,885.0 | 2,930 | -1.5% | |||||
| 78 | Oxoboxo River | 2,782.0 | 3,292 | -15.5% | |||||
| 79 | Essex Village | 2,705.0 | 2,515 | 7.6% | |||||
| 80 | Weatogue | 2,672.0 | 2,367 | 12.9% | |||||
| 81 | Glenville | 2,656.0 | 2,444 | 8.7% | |||||
| 82 | Coventry Lake | 2,647.0 | 2,782 | -4.9% | |||||
| 83 | Westbrook Center | 2,501.0 | 2,326 | 7.5% | |||||
| 84 | Deep River Center | 2,407.0 | 2,629 | -8.4% | |||||
| 85 | East Brooklyn | 2,377.0 | 1,539 | 54.5% | |||||
| 86 | Salmon Brook | 2,343.0 | 2,305 | 1.6% | |||||
| 87 | Plainfield Village | 2,316.0 | 2,364 | -2.0% | |||||
| 88 | Guilford Center | 2,263.0 | 2,619 | -13.6% | |||||
| 89 | Bethlehem Village | 2,195.0 | 2,223 | -1.3% | |||||
| 90 | Somers | 2,056.0 | 1,532 | 34.2% | |||||
| 91 | Moodus | 2,042.0 | 1,122 | 82.0% | |||||
| 92 | Chester Center | 2,026.0 | 1,618 | 25.2% | |||||
| 93 | Crystal Lake | 2,024.0 | 1,908 | 6.1% | |||||
| 94 | Suffield Depot | 2,006.0 | 1,169 | 71.6% | |||||
| 95 | Thomaston | 1,988.0 | 1,551 | 28.2% | |||||
| 96 | Madison Center | 1,981.0 | 2,245 | -11.8% | |||||
| 97 | Georgetown | 1,932.0 | 1,566 | 23.4% | |||||
| 98 | Ne | 1,898.0 | 1,998 | -5.0% | |||||
| 99 | Noank | 1,859.0 | 1,802 | 3.2% | |||||
| 100 | Higganum | 1,742.0 | 1,736 | 0.3% | |||||
| 101 | Wilton Center | 1,682.0 | 799 | 110.5% | |||||
| 102 | Blue Hills | 1,676.0 | 2,892 | -42.0% | |||||
| 103 | Woodmont | 1,661.0 | 1,734 | -4.2% | |||||
| 104 | Old Saybrook Center | 1,659.0 | 1,960 | -15.4% | |||||
| 105 | Woodbury Center | 1,606.0 | 1,476 | 8.8% | |||||
| 106 | Southport | 1,568.0 | 1,461 | 7.3% | |||||
| 107 | North Granby | 1,451.0 | 1,880 | -22.8% | |||||
| 108 | South Coventry | 1,434.0 | 1,358 | 5.6% | |||||
| 109 | Tariffville | 1,419.0 | 1,272 | 11.6% | |||||
| 110 | New Hartford Center | 1,373.0 | 1,138 | 20.7% | |||||
| 111 | Saybrook Manor | 1,358.0 | 1,325 | 2.5% | |||||
| 112 | South Woodstock | 1,340.0 | 1,142 | 17.3% | |||||
| 113 | South Windham | 1,281.0 | 1,604 | -20.1% | |||||
| 114 | Litchfield | 1,251.0 | 1,203 | 4.0% | |||||
| 115 | North Grosvenor Dale | 1,212.0 | 1,771 | -31.6% | |||||
| 116 | Quinebaug | 1,193.0 | 1,283 | -7.0% | |||||
| 117 | Canton Valley | 1,186.0 | 1,416 | -16.2% | |||||
| 118 | Baltic | 1,157.0 | 1,439 | -19.6% | |||||
| 119 | New Preston | 1,146.0 | 1,013 | 13.1% | |||||
| 120 | Gales Ferry | 1,141.0 | 1,031 | 10.7% | |||||
| 121 | Poquonock Bridge | 1,105.0 | 1,529 | -27.7% | |||||
| 122 | Wauregan | 1,049.0 | 903 | 16.2% | |||||