Bullhead City SnackAbility
Overall SnackAbility
Crime in Bullhead City summary. We use data from the FBI to determine the crime rates in Bullhead City. Key points include:
There were 1,163 total crimes in Bullhead City in the last reporting year.
The overall crime rate per 100,000 people in Bullhead City is 2,647.8 / 100k people.
The violent crime rate per 100,000 people in Bullhead City is 455.3 / 100k people.
The property crime rate per 100,000 people in Bullhead City is 2,192.5 / 100k people.
Overall, crime in Bullhead City is 24.94% above the national average.
Total Crimes
Above National Average
Crime In Bullhead City Comparison Table
| Statistic | Count Raw |
Bullhead City / 100k People |
Arizona / 100k People |
National / 100k People |
|---|---|---|---|---|
| Total Crimes Per 100K | 1,163 | 2,647.8 | 2,214.0 | 2,119.2 |
| Violent Crime | 200 | 455.3 | 421.9 | 359.0 |
| Murder | 1 | 2.3 | 4.9 | 5.0 |
| Robbery | 21 | 47.8 | 64.6 | 61.0 |
| Aggravated Assault | 172 | 391.6 | 312.4 | 256.0 |
| Property Crime | 963 | 2,192.5 | 1,792.1 | 1,760.0 |
| Burglary | 101 | 229.9 | 217.8 | 229.0 |
| Larceny | 745 | 1,696.2 | 1,329.9 | 1,272.0 |
| Car Theft | 117 | 266.4 | 244.4 | 259.0 |
Source: FBI Uniform Crime Reporting (2024)
Cost of living in Bullhead City summary. We use data on the cost of living to determine how expensive it is to live in Bullhead City. Real estate prices drive most of the variance in cost of living around Arizona. Key points include:
The cost of living in Bullhead City is 95 with 100 being average.
The cost of living in Bullhead City is 0.9x lower than the national average.
The median home value in Bullhead City is $299,831.
The median income in Bullhead City is $50,556.
Bullhead City's Overall Cost Of Living
Lower Than The National Average
Cost Of Living In Bullhead City Comparison Table
| Living Expense | Bullhead City | Arizona | National Average |
|---|---|---|---|
| Overall | 95 | 100 | 100 |
| Services | 102 | 99 | 100 |
| Groceries | 102 | 99 | 100 |
| Health | 84 | 97 | 100 |
| Housing | 102 | 104 | 100 |
| Transportation | 106 | 113 | 100 |
| Utilities | 99 | 104 | 100 |
Source: Cost of living index, normalized to US average = 100
Bullhead City, AZ Weather
The average high in Bullhead City is 80.6° and the average low is 52.9°.
There are 16.6 days of precipitation each year.
Expect an average of 7.7 inches of precipitation each year with 0.8 inches of snow.
| Stat | Bullhead City |
|---|---|
| Average Annual High | 80.6 |
| Average Annual Low | 52.9 |
| Annual Precipitation Days | 16.6 |
| Average Annual Precipitation | 7.7 |
| Average Annual Snowfall | 0.8 |
Average High
Days of Rain
Source: NOAA climate normals (30-year)
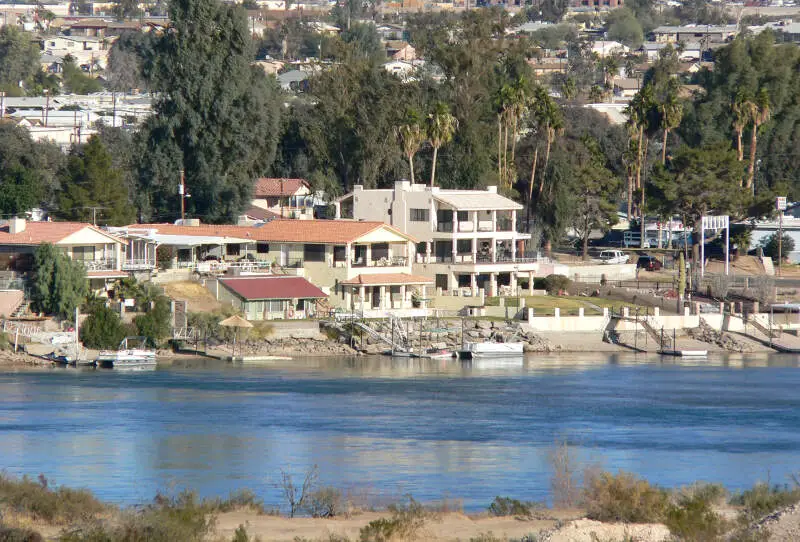
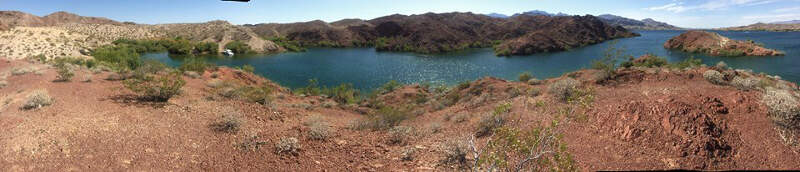
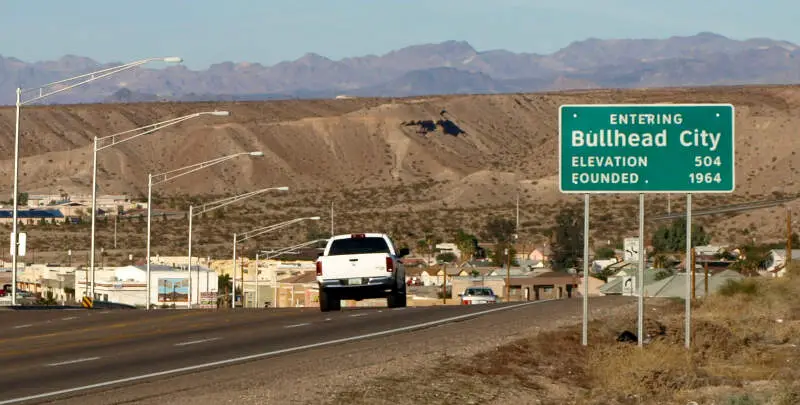
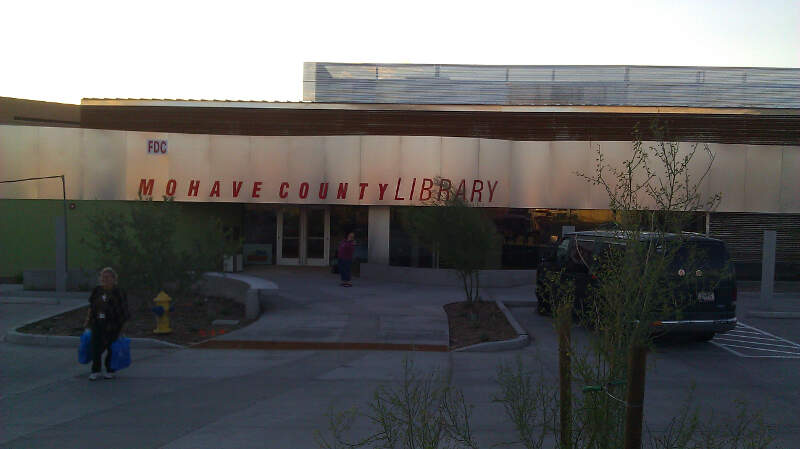
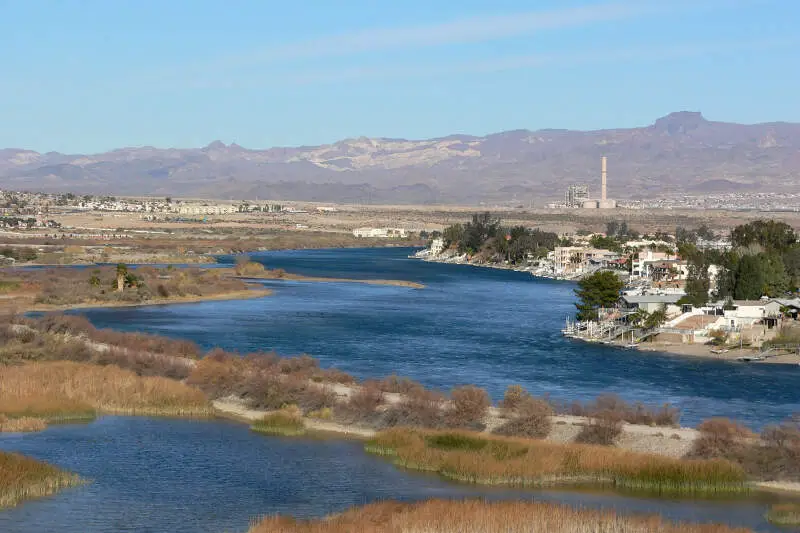
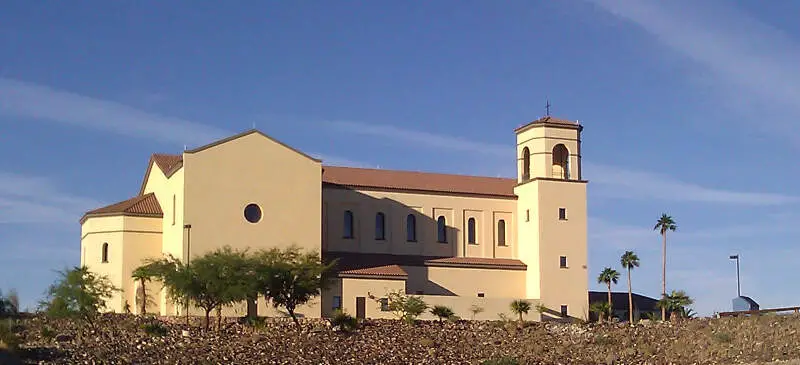
Bullhead City, AZ Photos
1 Reviews & Comments About Bullhead City

schools are awesome and the city has alot of places to go to
the school is good with great teachers who taught very well but theres always accidents or fires at random places. theres plenty of stores to go to which is good since if theres something one store doesnt have another does have
Rankings & Articles For Bullhead City


Locations Around Bullhead City
Map Of Bullhead City, AZ
Best Places Around Bullhead City
Bullhead City Demographics And Statistics
Population over time in Bullhead City
The current population in Bullhead City is 42,496. The population has increased 6.4% from 2010.
| Year | Population | % Change |
|---|---|---|
| 2024 | 42,496 | 0.7% |
| 2023 | 42,193 | 1.4% |
| 2022 | 41,593 | 1.3% |
| 2021 | 41,064 | 0.6% |
| 2020 | 40,808 | 1.4% |
| 2019 | 40,252 | 0.6% |
| 2018 | 40,024 | 0.5% |
| 2017 | 39,824 | 0.4% |
| 2016 | 39,653 | 0.6% |
| 2015 | 39,424 | -0.1% |
| 2014 | 39,480 | -0.2% |
| 2013 | 39,554 | -0.4% |
| 2012 | 39,694 | -0.5% |
| 2011 | 39,910 | -0.0% |
| 2010 | 39,925 | - |
Race / Ethnicity in Bullhead City
See the full breakdown
Bullhead City is:
68.7% White with 29,208 White residents.
1.6% African American with 663 African American residents.
0.5% American Indian with 202 American Indian residents.
1.5% Asian with 657 Asian residents.
0.0% Hawaiian with 0 Hawaiian residents.
0.1% Other with 39 Other residents.
4.8% Two Or More with 2,053 Two Or More residents.
22.8% Hispanic with 9,674 Hispanic residents.
| Race | Bullhead City | AZ | USA |
|---|---|---|---|
| White | 68.7% | 52.6% | 57.4% |
| African American | 1.6% | 4.4% | 11.9% |
| American Indian | 0.5% | 3.2% | 0.5% |
| Asian | 1.5% | 3.5% | 5.9% |
| Hawaiian | 0.0% | 0.2% | 0.2% |
| Other | 0.1% | 0.5% | 0.6% |
| Two Or More | 4.8% | 4.4% | 4.3% |
| Hispanic | 22.8% | 31.4% | 19.3% |
Gender in Bullhead City
See the full breakdown
Bullhead City is 49.2% female with 20,921 female residents.
Bullhead City is 50.8% male with 21,574 male residents.
| Gender | Bullhead City | AZ | USA |
|---|---|---|---|
| Female | 49.2% | 50.1% | 50.5% |
| Male | 50.8% | 49.9% | 49.5% |
Highest level of educational attainment in Bullhead City for adults over 25
See the full breakdown
5.0% of adults in Bullhead City completed < 9th grade.
8.0% of adults in Bullhead City completed 9-12th grade.
35.0% of adults in Bullhead City completed high school / ged.
27.0% of adults in Bullhead City completed some college.
9.0% of adults in Bullhead City completed associate's degree.
10.0% of adults in Bullhead City completed bachelor's degree.
4.0% of adults in Bullhead City completed master's degree.
1.0% of adults in Bullhead City completed professional degree.
1.0% of adults in Bullhead City completed doctorate degree.
| Education | Bullhead City | AZ | USA |
|---|---|---|---|
| < 9th Grade | 5.0% | 6.0% | 4.0% |
| 9-12th Grade | 8.0% | 6.0% | 6.0% |
| High School / GED | 35.0% | 23.0% | 26.0% |
| Some College | 27.0% | 23.0% | 19.0% |
| Associate's Degree | 9.0% | 9.0% | 9.0% |
| Bachelor's Degree | 10.0% | 20.0% | 22.0% |
| Master's Degree | 4.0% | 9.0% | 10.0% |
| Professional Degree | 1.0% | 2.0% | 2.0% |
| Doctorate Degree | 1.0% | 2.0% | 2.0% |
Household Income For Bullhead City, Arizona
See the full breakdown
7.3% of households in Bullhead City earn Less than $10,000.
5.4% of households in Bullhead City earn $10,000 to $14,999.
9.5% of households in Bullhead City earn $15,000 to $24,999.
13.8% of households in Bullhead City earn $25,000 to $34,999.
13.4% of households in Bullhead City earn $35,000 to $49,999.
20.8% of households in Bullhead City earn $50,000 to $74,999.
9.7% of households in Bullhead City earn $75,000 to $99,999.
11.8% of households in Bullhead City earn $100,000 to $149,999.
3.8% of households in Bullhead City earn $150,000 to $199,999.
4.6% of households in Bullhead City earn $200,000 or more.
| Income | Bullhead City | AZ | USA |
|---|---|---|---|
| Less than $10,000 | 7.3% | 5.0% | 5.0% |
| $10,000 to $14,999 | 5.4% | 2.7% | 3.4% |
| $15,000 to $24,999 | 9.5% | 5.8% | 6.3% |
| $25,000 to $34,999 | 13.8% | 6.6% | 6.6% |
| $35,000 to $49,999 | 13.4% | 10.5% | 10.1% |
| $50,000 to $74,999 | 20.8% | 16.5% | 15.5% |
| $75,000 to $99,999 | 9.7% | 13.5% | 12.6% |
| $100,000 to $149,999 | 11.8% | 18.4% | 17.5% |
| $150,000 to $199,999 | 3.8% | 9.4% | 9.6% |
| $200,000 or more | 4.6% | 11.6% | 13.4% |
Source: U.S. Census ACS 5-year estimates (2024)


