We all love the biggest cities that the Grand Canyon State has to offer. You know the places like Phoenix and Tucson which make all the headlines.
But there are a bunch of other great large cities in Arizona that don't get as much love.
We're going to change that right now.
Using the most recent Census data, we can tell you about all the places in Arizona with a focus on the biggest. We update the data each year and this is our fourth time doing this.
The Largest Cities In Arizona For 2026:
You can click here to see a full table of the 100 biggest cities in Arizona, along with every other place over 1,000 people big. It is sortable by clicking on the headers.
Read on below to see more on the biggest cities. Or for more reading on places to live in Arizona, check out:
The 10 Biggest Cities In Arizona

/10
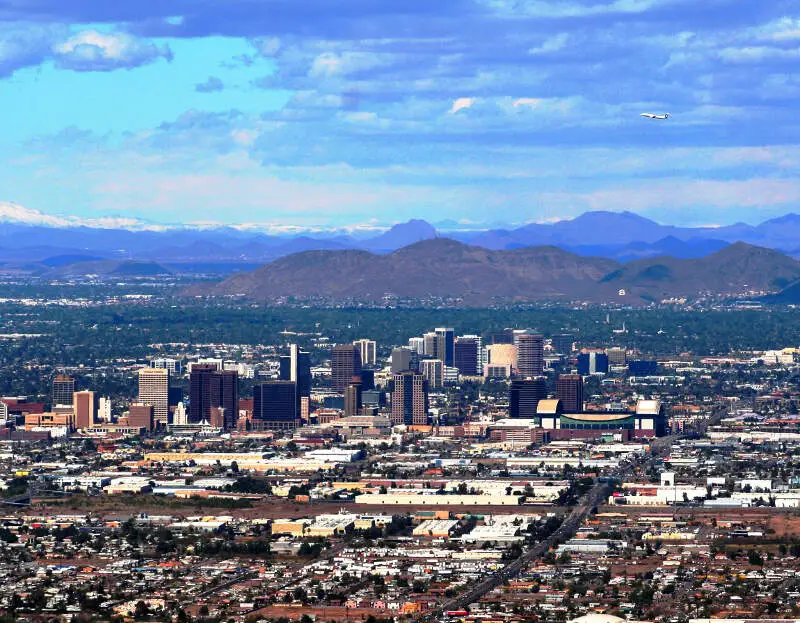
Rank Last Year: 1 (No Change)
Population: 1,642,323.0
Population 2010: 1,450,206
Growth: 13.2%
More on Phoenix: Data | Crime | Cost Of Living | Real Estate

/10
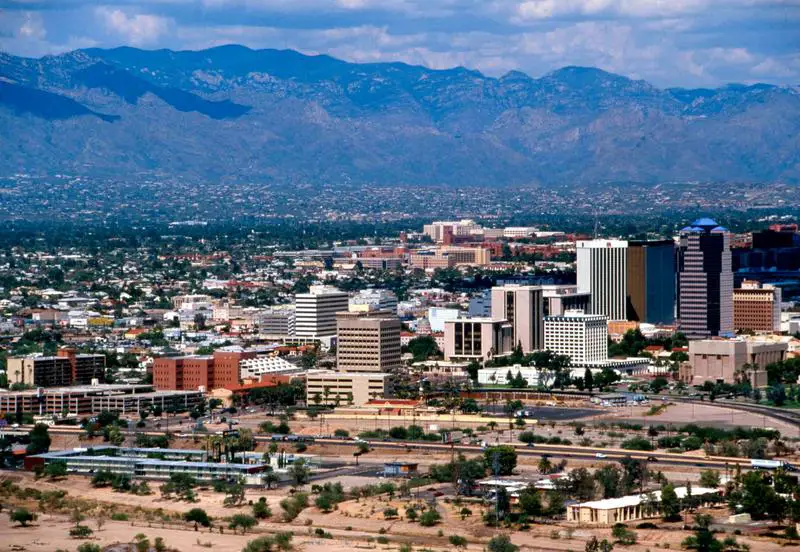
Rank Last Year: 2 (No Change)
Population: 547,073.0
Population 2010: 518,457
Growth: 5.5%
More on Tucson: Data | Crime | Cost Of Living | Real Estate

/10
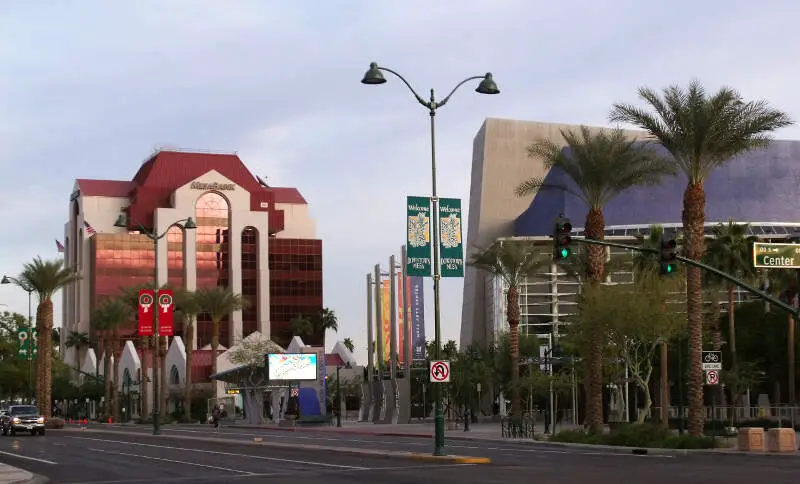
Rank Last Year: 3 (No Change)
Population: 511,764.0
Population 2010: 439,639
Growth: 16.4%
More on Mesa: Data | Crime | Cost Of Living | Real Estate

/10
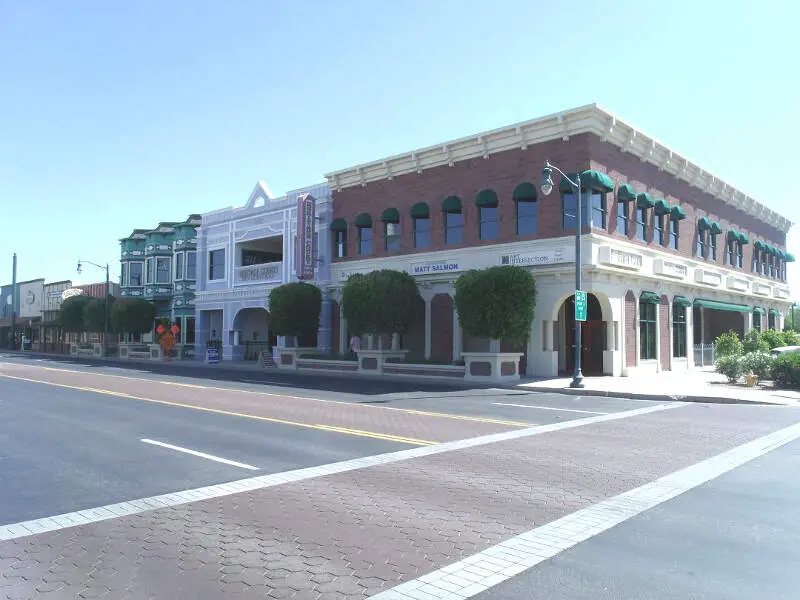
Rank Last Year: 5 (Up 1)
Population: 280,262.0
Population 2010: 195,046
Growth: 43.7%
More on Gilbert: Data | Crime | Cost Of Living | Real Estate

/10
Rank Last Year: 4 (Down 1)
Population: 280,136.0
Population 2010: 229,531
Growth: 22.0%
More on Chandler: Data | Crime | Cost Of Living | Real Estate

/10
Rank Last Year: 6 (No Change)
Population: 252,833.0
Population 2010: 229,687
Growth: 10.1%
More on Glendale: Data | Crime | Cost Of Living | Real Estate

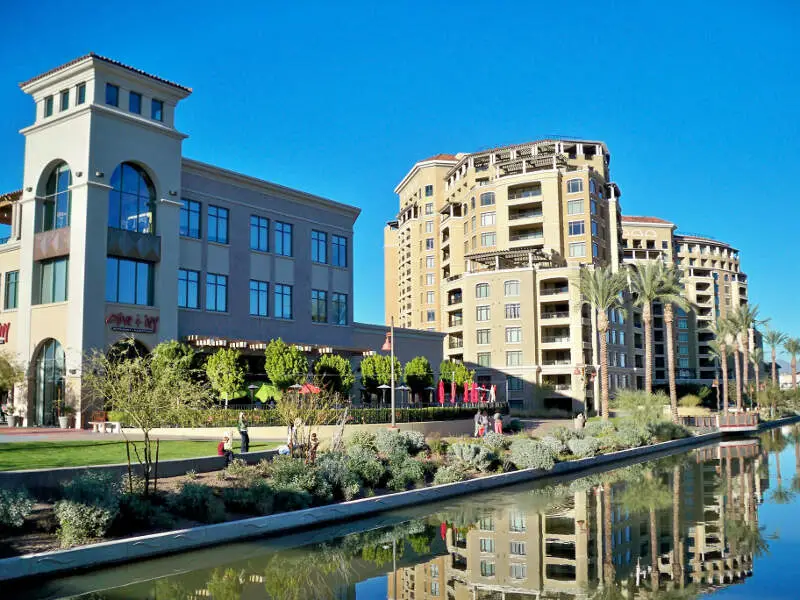
/10
Rank Last Year: 7 (No Change)
Population: 243,821.0
Population 2010: 218,770
Growth: 11.5%
More on Scottsdale: Data | Crime | Cost Of Living | Real Estate

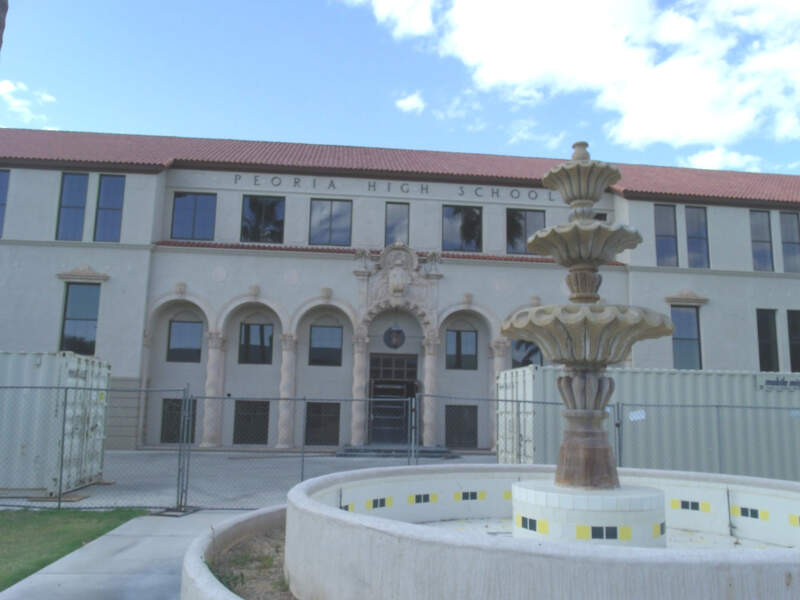
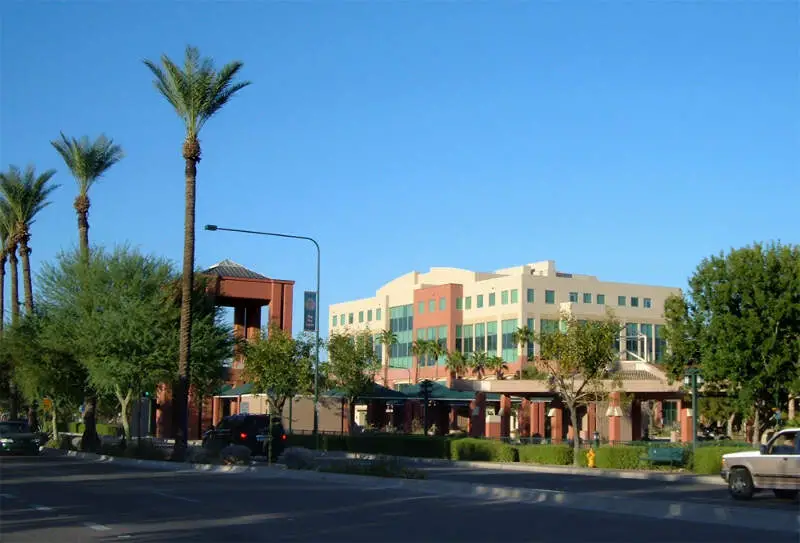
/10
Rank Last Year: 8 (No Change)
Population: 196,906.0
Population 2010: 148,702
Growth: 32.4%
More on Peoria: Data | Crime | Cost Of Living | Real Estate

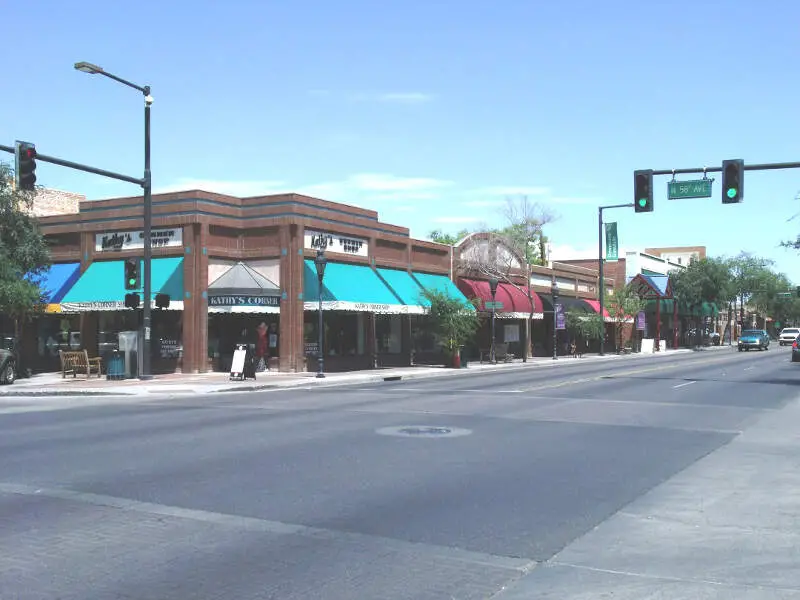
/10
Rank Last Year: 9 (No Change)
Population: 188,065.0
Population 2010: 164,147
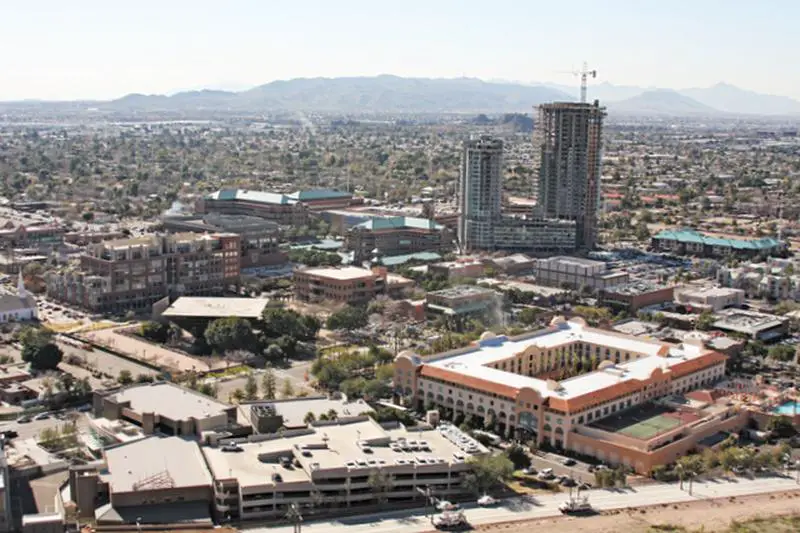
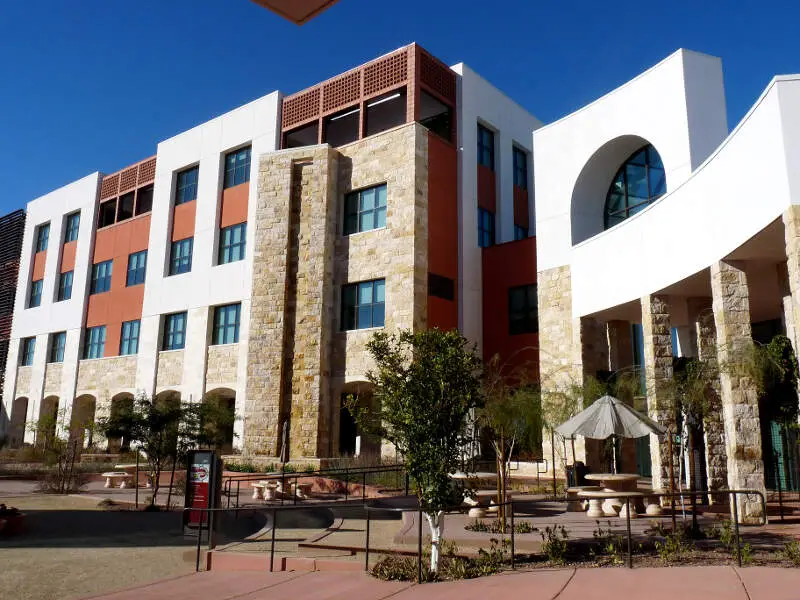
Growth: 14.6%
More on Tempe: Data | Crime | Cost Of Living | Real Estate

/10
Rank Last Year: 10 (No Change)
Population: 154,948.0
Population 2010: 103,767
Growth: 49.3%
More on Surprise: Data | Crime | Cost Of Living | Real Estate
How We Determined The Largest Cities In Arizona
We've been ranking and dissecting cities in the Grand Canyon State for over 4 years now -- making this actually the fourth time we've run the numbers. We always use the best data, the US Census. In this case, that means we are using the American Community Survey.
It what is probably the most simple analysis we run each year, we ranked every place in Arizona from biggest to smallest. The biggest city this year? That would be Phoenix.
The smallest? Tombstone, although there are places smaller than 1,000 people not listed here, so keep that in mind as we take a look at the top ten.
Now on to numbers 11-100 Biggest in Arizona
We hope that you find the big city, or really any city, that's right for you. Below is a list of the rest of the biggest cities along with every other place in Arizona.
Have fun snacking around in the Grand Canyon State!
For more reading on Arizona, check out:
- Best Places To Raise A Family In Arizona
- Best Places To Retire In Arizona
- Richest Cities In Arizona
- Safest Places In Arizona
- Worst Places To Live In Arizona
- Most Expensive Places To Live In Arizona
Detailed List Of The Biggest Cities In Arizona
| Rank | City | Current Population | 2010 | Growth |
|---|---|---|---|---|
| 1 | Phoenix | 1,642,323.0 | 1,450,206 | 13.2% |
| 2 | Tucson | 547,073.0 | 518,457 | 5.5% |
| 3 | Mesa | 511,764.0 | 439,639 | 16.4% |
| 4 | Gilbert | 280,262.0 | 195,046 | 43.7% |
| 5 | Chandler | 280,136.0 | 229,531 | 22.0% |
| 6 | Glendale | 252,833.0 | 229,687 | 10.1% |
| 7 | Scottsdale | 243,821.0 | 218,770 | 11.5% |
| 8 | Peoria | 196,906.0 | 148,702 | 32.4% |
| 9 | Tempe | 188,065.0 | 164,147 | 14.6% |
| 10 | Surprise | 154,948.0 | 103,767 | 49.3% |
| 11 | San Tan Valley | 109,189.0 | 64,085 | 70.4% |
| 12 | Goodyear | 107,645.0 | 57,869 | 86.0% |
| 13 | Yuma | 100,139.0 | 91,179 | 9.8% |
| 14 | Avondale | 92,477.0 | 70,274 | 31.6% |
| 15 | Flagstaff | 76,445.0 | 63,909 | 19.6% |
| 16 | Casas Adobes | 72,059.0 | 67,692 | 6.5% |
| 17 | Queen Creek | 71,867.0 | 23,055 | 211.7% |
| 18 | Maricopa | 67,163.0 | 34,809 | 92.9% |
| 19 | Casa Grande | 60,905.0 | 43,050 | 41.5% |
| 20 | Lake Havasu City | 58,359.0 | 52,474 | 11.2% |
| 21 | Marana | 56,938.0 | 31,443 | 81.1% |
| 22 | Catalina Foothills | 52,593.0 | 52,514 | 0.2% |
| 23 | Prescott Valley | 49,179.0 | 37,280 | 31.9% |
| 24 | Oro Valley | 48,162.0 | 39,776 | 21.1% |
| 25 | Prescott | 47,400.0 | 39,938 | 18.7% |
| 26 | Sierra Vista | 45,155.0 | 42,904 | 5.2% |
| 27 | Bullhead City | 42,496.0 | 39,925 | 6.4% |
| 28 | Apache Junction | 41,058.0 | 33,956 | 20.9% |
| 29 | Sun City | 37,486.0 | 38,339 | -2.2% |
| 30 | San Luis | 37,337.0 | 23,829 | 56.7% |
| 31 | El Mirage | 36,088.0 | 27,922 | 29.2% |
| 32 | Sahuarita | 35,862.0 | 21,607 | 66.0% |
| 33 | Kingman | 34,375.0 | 27,790 | 23.7% |
| 34 | Fortuna Foothills | 28,896.0 | 27,427 | 5.4% |
| 35 | Drexel Heights | 27,675.0 | 28,886 | -4.2% |
| 36 | Sun City West | 27,425.0 | 25,796 | 6.3% |
| 37 | Florence | 25,570.0 | 23,616 | 8.3% |
| 38 | Fountain Hills | 23,789.0 | 22,506 | 5.7% |
| 39 | Anthem | 22,584.0 | 19,828 | 13.9% |
| 40 | Green Valley | 22,114.0 | 21,403 | 3.3% |
| 41 | Rio Rico | 22,017.0 | 19,270 | 14.3% |
| 42 | Nogales | 19,841.0 | 20,972 | -5.4% |
| 43 | New River | 18,240.0 | 11,710 | 55.8% |
| 44 | Eloy | 17,433.0 | 15,125 | 15.3% |
| 45 | Coolidge | 16,636.0 | 10,817 | 53.8% |
| 46 | Payson | 16,622.0 | 15,026 | 10.6% |
| 47 | Flowing Wells | 16,559.0 | 16,142 | 2.6% |
| 48 | Vail | 16,315.0 | 9,238 | 76.6% |
| 49 | Douglas | 15,981.0 | 17,285 | -7.5% |
| 50 | Tanque Verde | 15,866.0 | 16,714 | -5.1% |
| 51 | Fort Mohave | 15,715.0 | 14,422 | 9.0% |
| 52 | Valencia West | 14,728.0 | 9,153 | 60.9% |
| 53 | Somerton | 14,574.0 | 13,230 | 10.2% |
| 54 | Sierra Vista Southeast | 14,330.0 | 15,297 | -6.3% |
| 55 | New Kingman-Butler | 13,993.0 | 14,500 | -3.5% |
| 56 | Sun Lakes | 13,924.0 | 13,505 | 3.1% |
| 57 | Chino Valley | 13,602.0 | 10,661 | 27.6% |
| 58 | Gold Canyon | 13,107.0 | 11,157 | 17.5% |
| 59 | Saddlebrooke | 13,085.0 | 9,005 | 45.3% |
| 60 | Paradise Valley | 12,611.0 | 13,198 | -4.4% |
| 61 | Cottonwood | 12,580.0 | 11,280 | 11.5% |
| 62 | Camp Verde | 12,521.0 | 10,922 | 14.6% |
| 63 | Tucson Estates | 12,136.0 | 12,106 | 0.2% |
| 64 | Show Low | 12,102.0 | 10,320 | 17.3% |
| 65 | Verde Village | 11,930.0 | 12,952 | -7.9% |
| 66 | Safford | 10,239.0 | 9,356 | 9.4% |
| 67 | Sedona | 9,777.0 | 10,307 | -5.1% |
| 68 | Corona De Tucson | 9,566.0 | 4,555 | 110.0% |
| 69 | Arizona City | 9,543.0 | 5,396 | 76.9% |
| 70 | Picture Rocks | 9,448.0 | 8,380 | 12.7% |
| 71 | Winslow | 8,773.0 | 9,736 | -9.9% |
| 72 | Golden Valley | 8,567.0 | 8,405 | 1.9% |
| 73 | Wickenburg | 8,059.0 | 6,517 | 23.7% |
| 74 | Tuba City | 7,960.0 | 8,888 | -10.4% |
| 75 | Tolleson | 7,668.0 | 6,386 | 20.1% |
| 76 | Page | 7,345.0 | 7,199 | 2.0% |
| 77 | Globe | 7,195.0 | 7,557 | -4.8% |
| 78 | Youn | 7,015.0 | 5,684 | 23.4% |
| 79 | Litchfield Park | 6,916.0 | 5,271 | 31.2% |
| 80 | Rincon Valley | 6,512.0 | 4,298 | 51.5% |
| 81 | Catalina | 6,489.0 | 8,200 | -20.9% |
| 82 | Snowflake | 6,444.0 | 5,461 | 18.0% |
| 83 | Village Of Oak Creek (Big Park) | 6,356.0 | 6,523 | -2.6% |
| 84 | Williamson | 6,310.0 | 5,509 | 14.5% |
| 85 | Avra Valley | 6,277.0 | 6,689 | -6.2% |
| 86 | Doney Park | 6,253.0 | 6,370 | -1.8% |
| 87 | Thatcher | 5,439.0 | 4,667 | 16.5% |
| 88 | Benson | 5,417.0 | 5,056 | 7.1% |
| 89 | Guadalupe | 5,272.0 | 5,577 | -5.5% |
| 90 | Three Points | 5,254.0 | 5,176 | 1.5% |
| 91 | Citrus Park | 5,115.0 | 3,727 | 37.2% |
| 92 | Cave Creek | 5,091.0 | 4,911 | 3.7% |
| 93 | Bisbee | 4,977.0 | 5,715 | -12.9% |
| 94 | San Carlos | 4,973.0 | 5,523 | -10.0% |
| 95 | Lake Montezuma | 4,929.0 | 4,112 | 19.9% |
| 96 | Kayenta | 4,927.0 | 4,668 | 5.5% |
| 97 | Summit | 4,896.0 | 3,637 | 34.6% |
| 98 | Holbrook | 4,858.0 | 5,100 | -4.7% |
| 99 | Paulden | 4,795.0 | 4,333 | 10.7% |
| 100 | Clarkdale | 4,758.0 | 4,098 | 16.1% |
| 101 | South Tucson | 4,550.0 | 5,673 | -19.8% |
| 102 | Whiteriver | 4,545.0 | 3,908 | 16.3% |
| 103 | Dewey-Humboldt | 4,501.0 | 3,936 | 14.4% |
| 104 | Eagar | 4,416.0 | 4,682 | -5.7% |
| 105 | Taylor | 4,183.0 | 4,010 | 4.3% |
| 106 | Chinle | 4,147.0 | 4,322 | -4.0% |
| 107 | Pinetop-Lakeside | 4,101.0 | 4,215 | -2.7% |
| 108 | Avenue B And C | 4,001.0 | 3,817 | 4.8% |
| 109 | Clifton | 3,822.0 | 3,140 | 21.7% |
| 110 | Cordes Lakes | 3,808.0 | 2,531 | 50.5% |
| 111 | Carefree | 3,683.0 | 3,341 | 10.2% |
| 112 | Heber-Overgaard | 3,621.0 | 2,800 | 29.3% |
| 113 | Cornville | 3,618.0 | 2,830 | 27.8% |
| 114 | San Manuel | 3,491.0 | 4,377 | -20.2% |
| 115 | Sacaton | 3,429.0 | 3,580 | -4.2% |
| 116 | St. Johns | 3,395.0 | 3,454 | -1.7% |
| 117 | Parker | 3,388.0 | 3,173 | 6.8% |
| 118 | Williams | 3,369.0 | 2,999 | 12.3% |
| 119 | Fort Defiance | 3,351.0 | 4,349 | -22.9% |
| 120 | Lake Of The Woods | 3,250.0 | 4,294 | -24.3% |
| 121 | Willcox | 3,222.0 | 3,767 | -14.5% |
| 122 | Kachina Village | 3,212.0 | 3,154 | 1.8% |
| 123 | Oracle | 3,146.0 | 3,228 | -2.5% |
| 124 | Ajo | 3,107.0 | 3,206 | -3.1% |
| 125 | Pima | 2,995.0 | 2,415 | 24.0% |
| 126 | Whetstone | 2,971.0 | 2,442 | 21.7% |
| 127 | Desert Hills | 2,944.0 | 1,805 | 63.1% |
| 128 | White Mountain Lake | 2,910.0 | 1,866 | 55.9% |
| 129 | Central Heights-Midland City | 2,909.0 | 2,714 | 7.2% |
| 130 | Swift Trail Junction | 2,859.0 | 2,124 | 34.6% |
| 131 | Bagdad | 2,814.0 | 1,956 | 43.9% |
| 132 | Colorado City | 2,702.0 | 4,722 | -42.8% |
| 133 | Mohave Valley | 2,555.0 | 2,261 | 13.0% |
| 134 | Superior | 2,535.0 | 2,799 | -9.4% |
| 135 | Wellton | 2,527.0 | 2,730 | -7.4% |
| 136 | Star Valley | 2,525.0 | 2,403 | 5.1% |
| 137 | Linden | 2,502.0 | 2,890 | -13.4% |
| 138 | Window Rock | 2,477.0 | 3,612 | -31.4% |
| 139 | Valle Vista | 2,369.0 | 1,887 | 25.5% |
| 140 | Rio Verde | 2,261.0 | 1,757 | 28.7% |
| 141 | Cibecue | 2,228.0 | 1,483 | 50.2% |
| 142 | Black Canyon City | 2,181.0 | 2,499 | -12.7% |
| 143 | Joseph City | 2,153.0 | 1,477 | 45.8% |
| 144 | Kearny | 2,109.0 | 2,090 | 0.9% |
| 145 | Pinetop Country Club | 2,054.0 | 2,507 | -18.1% |
| 146 | Springerville | 2,008.0 | 2,663 | -24.6% |
| 147 | Lukachukai | 1,969.0 | 1,790 | 10.0% |
| 148 | Cienega Springs | 1,958.0 | 2,869 | -31.8% |
| 149 | Blackwater | 1,958.0 | 520 | 276.5% |
| 150 | Pirtleville | 1,939.0 | 1,264 | 53.4% |
| 151 | Sells | 1,935.0 | 2,272 | -14.8% |
| 152 | Quartzsite | 1,877.0 | 3,653 | -48.6% |
| 153 | Centennial Park | 1,839.0 | 831 | 121.3% |
| 154 | Fort Valley | 1,761.0 | 1,166 | 51.0% |
| 155 | Mescal | 1,760.0 | 1,345 | 30.9% |
| 156 | Tonto Basin | 1,750.0 | 847 | 106.6% |
| 157 | Pine | 1,740.0 | 2,133 | -18.4% |
| 158 | Wagon Wheel | 1,716.0 | 2,284 | -24.9% |
| 159 | Parks | 1,706.0 | 900 | 89.6% |
| 160 | Casa Blanca | 1,697.0 | 1,300 | 30.5% |
| 161 | Tsaile | 1,696.0 | 885 | 91.6% |
| 162 | Morenci | 1,673.0 | 2,091 | -20.0% |
| 163 | Spring Valley | 1,673.0 | 1,241 | 34.8% |
| 164 | Kaibito | 1,661.0 | 1,838 | -9.6% |
| 165 | Beaver Dam | 1,624.0 | 1,104 | 47.1% |
| 166 | Huachuca City | 1,614.0 | 1,913 | -15.6% |
| 167 | Grand Canyon Village | 1,599.0 | 1,193 | 34.0% |
| 168 | Golden Shores | 1,555.0 | 2,236 | -30.5% |
| 169 | Bylas | 1,551.0 | 1,563 | -0.8% |
| 170 | Meadview | 1,517.0 | 1,284 | 18.1% |
| 171 | Cactus Flats | 1,508.0 | 1,515 | -0.5% |
| 172 | Congress | 1,491.0 | 1,575 | -5.3% |
| 173 | North Fork | 1,463.0 | 1,755 | -16.6% |
| 174 | First Mesa | 1,459.0 | 1,961 | -25.6% |
| 175 | Miami | 1,405.0 | 2,114 | -33.5% |
| 176 | Scenic | 1,379.0 | 657 | 109.9% |
| 177 | Gila Bend | 1,363.0 | 1,646 | -17.2% |
| 178 | Dolan Springs | 1,341.0 | 1,655 | -19.0% |
| 179 | Lechee | 1,307.0 | 1,611 | -18.9% |
| 180 | Tubac | 1,294.0 | 685 | 88.9% |
| 181 | Dilkon | 1,270.0 | 1,465 | -13.3% |
| 182 | Claypool | 1,259.0 | 1,920 | -34.4% |
| 183 | Peach Springs | 1,234.0 | 617 | 100.0% |
| 184 | Bouse | 1,203.0 | 825 | 45.8% |
| 185 | Mammoth | 1,191.0 | 1,099 | 8.4% |
| 186 | Canyon Day | 1,182.0 | 398 | 197.0% |
| 187 | Pinon | 1,159.0 | 888 | 30.5% |
| 188 | St. Michaels | 1,142.0 | 950 | 20.2% |
| 189 | Ak-Chin Village | 1,132.0 | 903 | 25.4% |
| 190 | Queen Valley | 1,118.0 | 701 | 59.5% |
| 191 | Mountainaire | 1,103.0 | 1,357 | -18.7% |
| 192 | Wilhoit | 1,101.0 | 959 | 14.8% |
| 193 | St. David | 1,098.0 | 1,808 | -39.3% |
| 194 | Strawberry | 1,094.0 | 795 | 37.6% |
| 195 | Shongopovi | 1,084.0 | 1,316 | -17.6% |
| 196 | Fredonia | 1,061.0 | 1,167 | -9.1% |
| 197 | Naco | 1,060.0 | 877 | 20.9% |
| 198 | Tombstone | 1,026.0 | 1,307 | -21.5% |