Flagstaff SnackAbility
Overall SnackAbility
Crime in Flagstaff summary. We use data from the FBI to determine the crime rates in Flagstaff. Key points include:
There were 2,060 total crimes in Flagstaff in the last reporting year.
The overall crime rate per 100,000 people in Flagstaff is 2,695.2 / 100k people.
The violent crime rate per 100,000 people in Flagstaff is 463.2 / 100k people.
The property crime rate per 100,000 people in Flagstaff is 2,232.0 / 100k people.
Overall, crime in Flagstaff is 27.18% above the national average.
Total Crimes
Above National Average
Crime In Flagstaff Comparison Table
| Statistic | Count Raw |
Flagstaff / 100k People |
Arizona / 100k People |
National / 100k People |
|---|---|---|---|---|
| Total Crimes Per 100K | 2,060 | 2,695.2 | 2,214.0 | 2,119.2 |
| Violent Crime | 354 | 463.2 | 421.9 | 359.0 |
| Murder | 5 | 6.5 | 4.9 | 5.0 |
| Robbery | 41 | 53.6 | 64.6 | 61.0 |
| Aggravated Assault | 254 | 332.3 | 312.4 | 256.0 |
| Property Crime | 1,706 | 2,232.0 | 1,792.1 | 1,760.0 |
| Burglary | 94 | 123.0 | 217.8 | 229.0 |
| Larceny | 1,506 | 1,970.4 | 1,329.9 | 1,272.0 |
| Car Theft | 106 | 138.7 | 244.4 | 259.0 |
Source: FBI Uniform Crime Reporting (2024)
Cost of living in Flagstaff summary. We use data on the cost of living to determine how expensive it is to live in Flagstaff. Real estate prices drive most of the variance in cost of living around Arizona. Key points include:
The cost of living in Flagstaff is 128 with 100 being average.
The cost of living in Flagstaff is 1.3x higher than the national average.
The median home value in Flagstaff is $656,480.
The median income in Flagstaff is $71,512.
Flagstaff's Overall Cost Of Living
Higher Than The National Average
Cost Of Living In Flagstaff Comparison Table
| Living Expense | Flagstaff | Arizona | National Average |
|---|---|---|---|
| Overall | 128 | 100 | 100 |
| Services | 101 | 99 | 100 |
| Groceries | 103 | 99 | 100 |
| Health | 180 | 97 | 100 |
| Housing | 99 | 104 | 100 |
| Transportation | 114 | 113 | 100 |
| Utilities | 102 | 104 | 100 |
Source: Cost of living index, normalized to US average = 100
Flagstaff, AZ Weather
The average high in Flagstaff is 66.3° and the average low is 37.0°.
There are 36.9 days of precipitation each year.
Expect an average of 15.6 inches of precipitation each year with 47.1 inches of snow.
| Stat | Flagstaff |
|---|---|
| Average Annual High | 66.3 |
| Average Annual Low | 37.0 |
| Annual Precipitation Days | 36.9 |
| Average Annual Precipitation | 15.6 |
| Average Annual Snowfall | 47.1 |
Average High
Days of Rain
Source: NOAA climate normals (30-year)
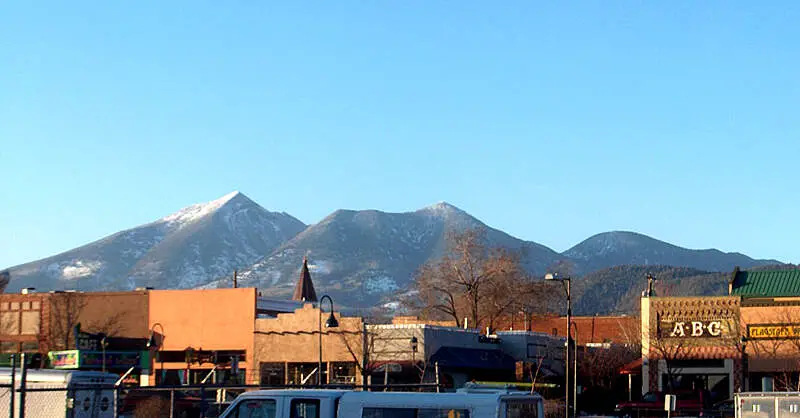
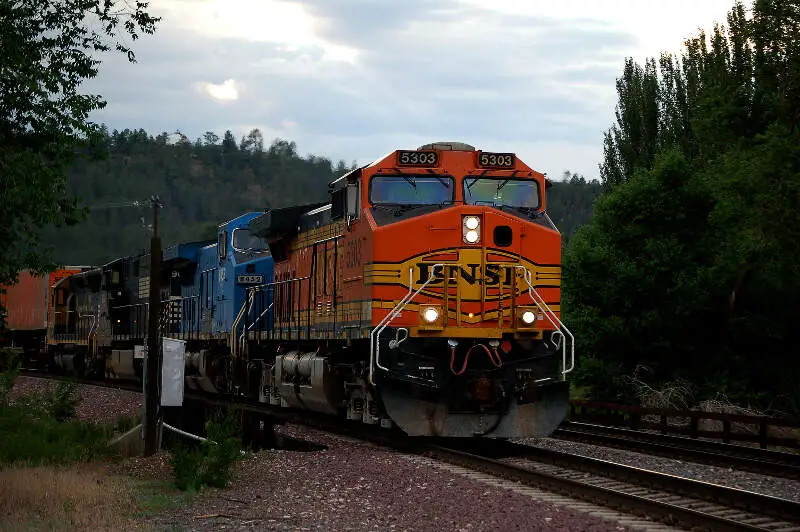
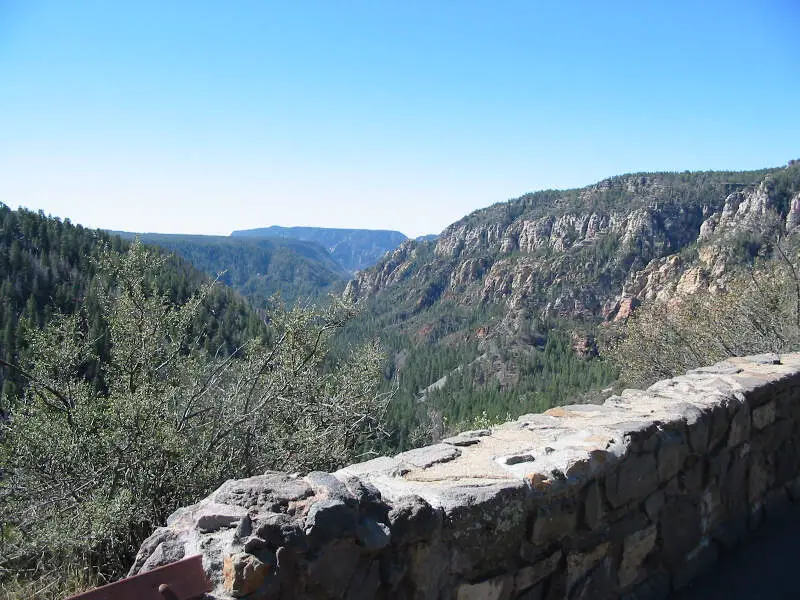
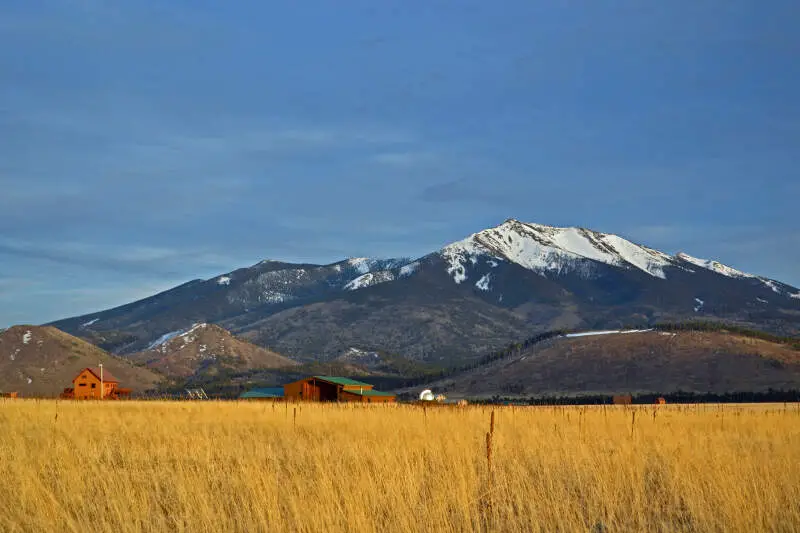
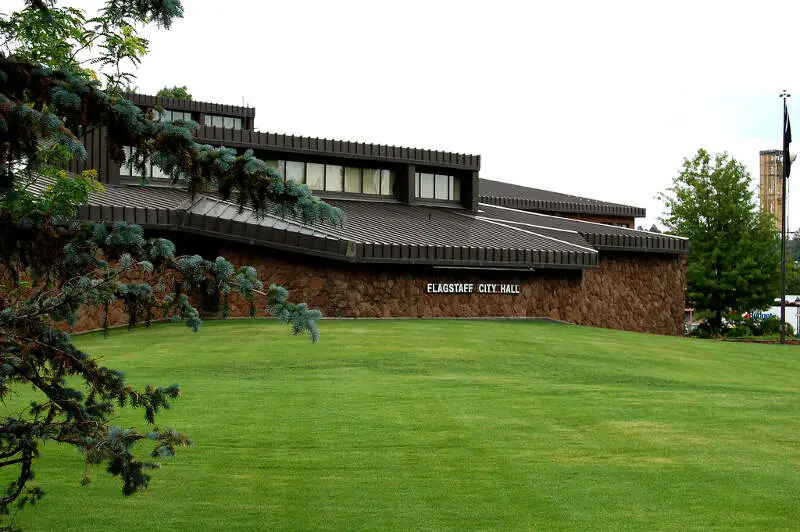
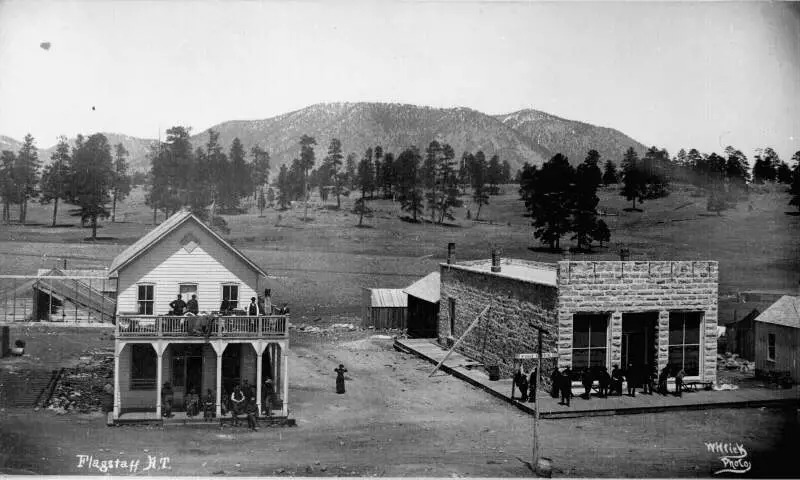
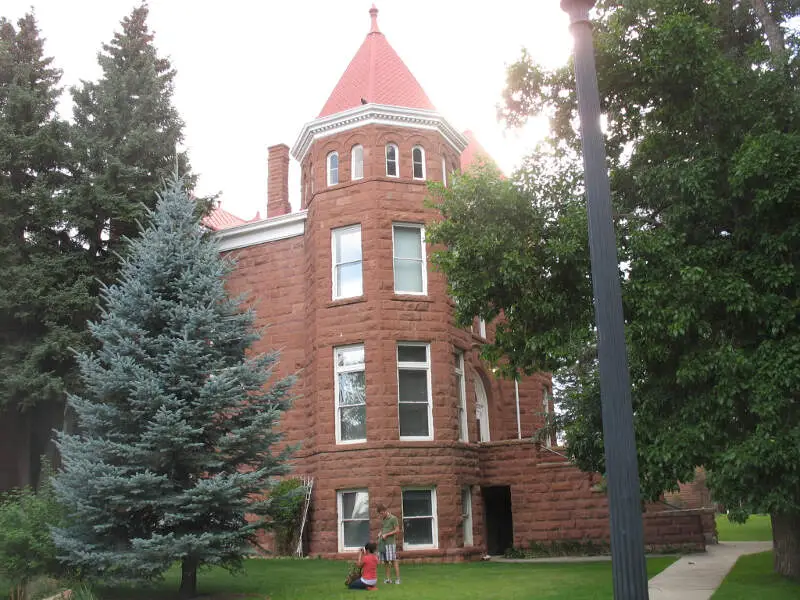
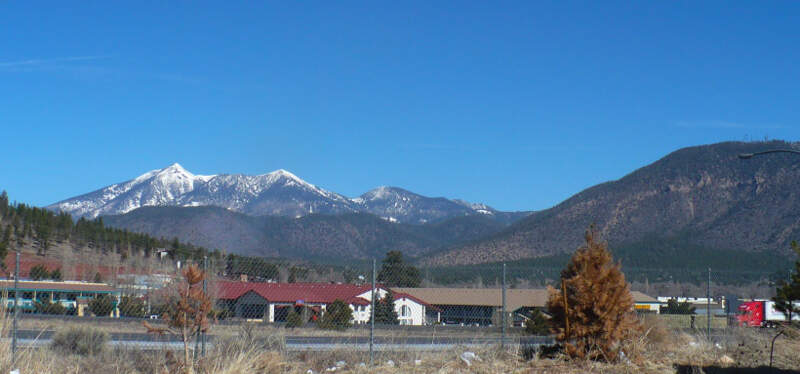
Flagstaff, AZ Photos
2 Reviews & Comments About Flagstaff

I lover Flagstaff, AZ. If you love the outdoors, then you will love it here. You can go to the Grand Canyon. You can hike a volcano, you can see indigenous dwellings, you can go to Walnut Canyon and see the indigenous dwellings carved out of the mountain side. You can hike in a cave and go off-roading. The downtown area is cute with decent food and entertainment. Good coffee shops.
My favorite thing was going to this trout farm on the way to Sedona, Az. The best trout I have every tasted. You catch it, they clean it, then you grill it right there, surrounded by the mountains.
I arrived at night and went to a local bar because it was the only thing open and it was freezing out. Some drunk guy offered to let me sleep on his couch but he was so drunk that I thought it would be better to just sleep in my car. It was so cold though, I left my motor running the whole night. In the morning I warmed up at a cozy diner.
The bar was your run of the mill dive bar. Except the people there were exceptionally nice.
The diner let me brush my teeth and use the bathroom even after I had paid and left.
Rankings & Articles For Flagstaff


Locations Around Flagstaff
Map Of Flagstaff, AZ
Best Places Around Flagstaff
Village of Oak Creek (Big Park), AZ
Population 6,356
Sedona, AZ
Population 9,777
Camp Verde, AZ
Population 12,521
Cottonwood, AZ
Population 12,580
Cottonwood, AZ
Population 12,580
Flagstaff Demographics And Statistics
Population over time in Flagstaff
The current population in Flagstaff is 76,445. The population has increased 19.6% from 2010.
| Year | Population | % Change |
|---|---|---|
| 2024 | 76,445 | 0.1% |
| 2023 | 76,333 | 0.2% |
| 2022 | 76,177 | -0.1% |
| 2021 | 76,228 | 4.0% |
| 2020 | 73,319 | 1.3% |
| 2019 | 72,402 | 1.7% |
| 2018 | 71,202 | 1.9% |
| 2017 | 69,903 | 0.9% |
| 2016 | 69,270 | 1.3% |
| 2015 | 68,375 | 1.4% |
| 2014 | 67,419 | 1.3% |
| 2013 | 66,569 | 1.4% |
| 2012 | 65,660 | 1.4% |
| 2011 | 64,758 | 1.3% |
| 2010 | 63,909 | - |
Race / Ethnicity in Flagstaff
See the full breakdown
Flagstaff is:
57.6% White with 44,029 White residents.
1.8% African American with 1,364 African American residents.
12.8% American Indian with 9,803 American Indian residents.
2.3% Asian with 1,771 Asian residents.
0.2% Hawaiian with 120 Hawaiian residents.
0.6% Other with 483 Other residents.
5.1% Two Or More with 3,872 Two Or More residents.
19.6% Hispanic with 15,003 Hispanic residents.
| Race | Flagstaff | AZ | USA |
|---|---|---|---|
| White | 57.6% | 52.6% | 57.4% |
| African American | 1.8% | 4.4% | 11.9% |
| American Indian | 12.8% | 3.2% | 0.5% |
| Asian | 2.3% | 3.5% | 5.9% |
| Hawaiian | 0.2% | 0.2% | 0.2% |
| Other | 0.6% | 0.5% | 0.6% |
| Two Or More | 5.1% | 4.4% | 4.3% |
| Hispanic | 19.6% | 31.4% | 19.3% |
Gender in Flagstaff
See the full breakdown
Flagstaff is 51.0% female with 38,971 female residents.
Flagstaff is 49.0% male with 37,474 male residents.
| Gender | Flagstaff | AZ | USA |
|---|---|---|---|
| Female | 51.0% | 50.1% | 50.5% |
| Male | 49.0% | 49.9% | 49.5% |
Highest level of educational attainment in Flagstaff for adults over 25
See the full breakdown
2.0% of adults in Flagstaff completed < 9th grade.
2.0% of adults in Flagstaff completed 9-12th grade.
15.0% of adults in Flagstaff completed high school / ged.
21.0% of adults in Flagstaff completed some college.
8.0% of adults in Flagstaff completed associate's degree.
31.0% of adults in Flagstaff completed bachelor's degree.
14.0% of adults in Flagstaff completed master's degree.
3.0% of adults in Flagstaff completed professional degree.
4.0% of adults in Flagstaff completed doctorate degree.
| Education | Flagstaff | AZ | USA |
|---|---|---|---|
| < 9th Grade | 2.0% | 6.0% | 4.0% |
| 9-12th Grade | 2.0% | 6.0% | 6.0% |
| High School / GED | 15.0% | 23.0% | 26.0% |
| Some College | 21.0% | 23.0% | 19.0% |
| Associate's Degree | 8.0% | 9.0% | 9.0% |
| Bachelor's Degree | 31.0% | 20.0% | 22.0% |
| Master's Degree | 14.0% | 9.0% | 10.0% |
| Professional Degree | 3.0% | 2.0% | 2.0% |
| Doctorate Degree | 4.0% | 2.0% | 2.0% |
Household Income For Flagstaff, Arizona
See the full breakdown
5.4% of households in Flagstaff earn Less than $10,000.
3.7% of households in Flagstaff earn $10,000 to $14,999.
7.1% of households in Flagstaff earn $15,000 to $24,999.
7.9% of households in Flagstaff earn $25,000 to $34,999.
11.0% of households in Flagstaff earn $35,000 to $49,999.
17.5% of households in Flagstaff earn $50,000 to $74,999.
12.7% of households in Flagstaff earn $75,000 to $99,999.
15.9% of households in Flagstaff earn $100,000 to $149,999.
8.0% of households in Flagstaff earn $150,000 to $199,999.
10.7% of households in Flagstaff earn $200,000 or more.
| Income | Flagstaff | AZ | USA |
|---|---|---|---|
| Less than $10,000 | 5.4% | 5.0% | 5.0% |
| $10,000 to $14,999 | 3.7% | 2.7% | 3.4% |
| $15,000 to $24,999 | 7.1% | 5.8% | 6.3% |
| $25,000 to $34,999 | 7.9% | 6.6% | 6.6% |
| $35,000 to $49,999 | 11.0% | 10.5% | 10.1% |
| $50,000 to $74,999 | 17.5% | 16.5% | 15.5% |
| $75,000 to $99,999 | 12.7% | 13.5% | 12.6% |
| $100,000 to $149,999 | 15.9% | 18.4% | 17.5% |
| $150,000 to $199,999 | 8.0% | 9.4% | 9.6% |
| $200,000 or more | 10.7% | 11.6% | 13.4% |
Source: U.S. Census ACS 5-year estimates (2024)


