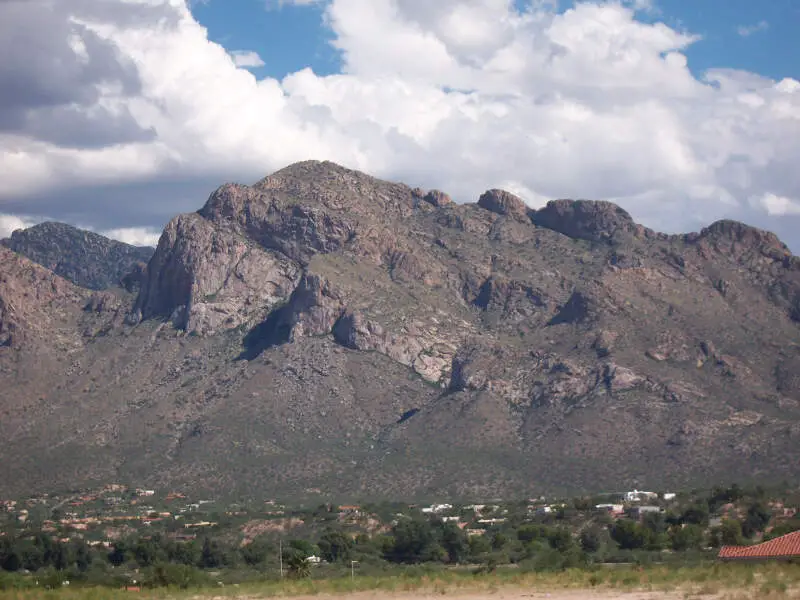
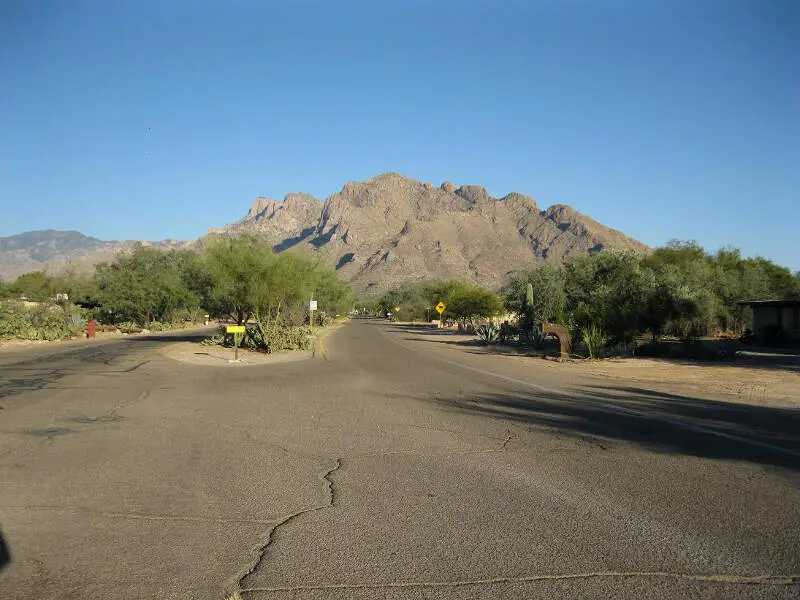
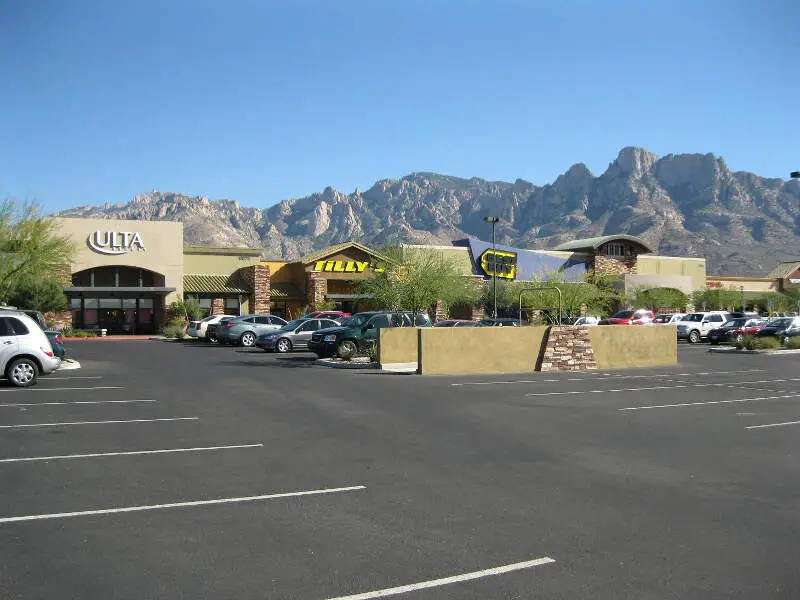
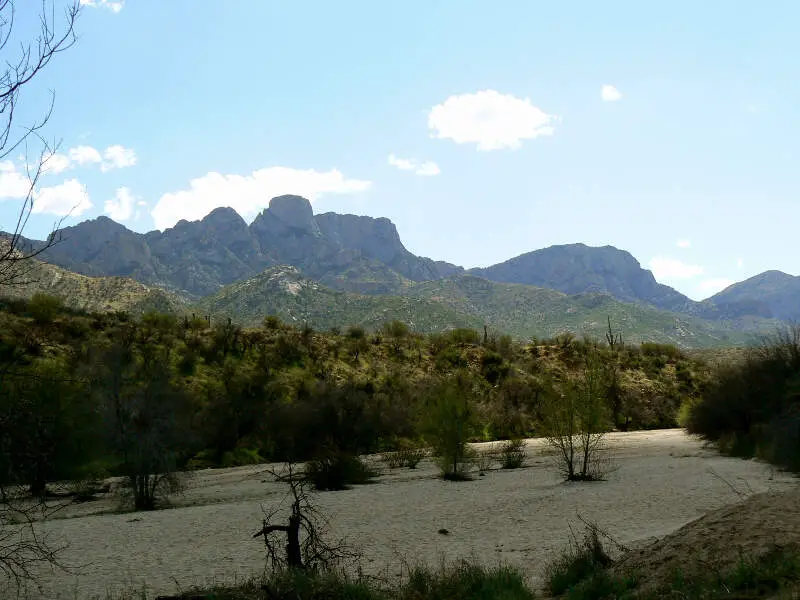
Oro Valley, AZ
Demographics And Statistics
Living In Oro Valley, Arizona Summary
Life in Oro Valley research summary. HomeSnacks has been using Saturday Night Science to research the quality of life in Oro Valley over the past nine years using Census, FBI, Zillow, and other primary data sources. Based on the most recently available data, we found the following about life in Oro Valley:
The population in Oro Valley is 47,595.
The median home value in Oro Valley is $504,877.
The median income in Oro Valley is $105,342.
The cost of living in Oro Valley is 125 which is 1.2x higher than the national average.
The median rent in Oro Valley is $1,602.
The unemployment rate in Oro Valley is 2.7%.
The poverty rate in Oro Valley is 6.3%.
The average high in Oro Valley is 83.2° and the average low is 54.0°.
Oro Valley SnackAbility
Overall SnackAbility
Oro Valley, AZ Crime Report
Crime in Oro Valley summary. We use data from the FBI to determine the crime rates in Oro Valley. Key points include:
There were 584 total crimes in Oro Valley in the last reporting year.
The overall crime rate per 100,000 people in Oro Valley is 1,199.7 / 100k people.
The violent crime rate per 100,000 people in Oro Valley is 51.4 / 100k people.
The property crime rate per 100,000 people in Oro Valley is 1,148.3 / 100k people.
Overall, crime in Oro Valley is -43.39% below the national average.
Total Crimes
Below National Average
Crime In Oro Valley Comparison Table
| Statistic | Count Raw |
Oro Valley / 100k People |
Arizona / 100k People |
National / 100k People |
|---|---|---|---|---|
| Total Crimes Per 100K | 584 | 1,199.7 | 2,214.0 | 2,119.2 |
| Violent Crime | 25 | 51.4 | 421.9 | 359.0 |
| Murder | 0 | 0.0 | 4.9 | 5.0 |
| Robbery | 1 | 2.1 | 64.6 | 61.0 |
| Aggravated Assault | 21 | 43.1 | 312.4 | 256.0 |
| Property Crime | 559 | 1,148.3 | 1,792.1 | 1,760.0 |
| Burglary | 28 | 57.5 | 217.8 | 229.0 |
| Larceny | 511 | 1,049.7 | 1,329.9 | 1,272.0 |
| Car Theft | 20 | 41.1 | 244.4 | 259.0 |
Oro Valley, AZ Cost Of Living
Cost of living in Oro Valley summary. We use data on the cost of living to determine how expensive it is to live in Oro Valley. Real estate prices drive most of the variance in cost of living around Arizona. Key points include:
The cost of living in Oro Valley is 125 with 100 being average.
The cost of living in Oro Valley is 1.2x higher than the national average.
The median home value in Oro Valley is $504,877.
The median income in Oro Valley is $105,342.
Oro Valley's Overall Cost Of Living
Higher Than The National Average
Cost Of Living In Oro Valley Comparison Table
| Living Expense | Oro Valley | Arizona | National Average | |
|---|---|---|---|---|
| Overall | 125 | 102 | 100 | |
| Services | 110 | 102 | 100 | |
| Groceries | 107 | 103 | 100 | |
| Health | 91 | 95 | 100 | |
| Housing | 166 | 99 | 100 | |
| Transportation | 108 | 107 | 100 | |
| Utilities | 100 | 96 | 100 | |
Oro Valley, AZ Weather
The average high in Oro Valley is 83.2° and the average low is 54.0°.
There are 30.8 days of precipitation each year.
Expect an average of 12.8 inches of precipitation each year with 0.7 inches of snow.
| Stat | Oro Valley |
|---|---|
| Average Annual High | 83.2 |
| Average Annual Low | 54.0 |
| Annual Precipitation Days | 30.8 |
| Average Annual Precipitation | 12.8 |
| Average Annual Snowfall | 0.7 |
Average High
Days of Rain
Oro Valley, AZ Photos

Rankings for Oro Valley in Arizona


Locations Around Oro Valley
Map Of Oro Valley, AZ
Best Places Around Oro Valley
Catalina Foothills, AZ
Population 51,756
Marana, AZ
Population 54,487
Tanque Verde, AZ
Population 15,531
Casas Adobes, AZ
Population 70,770
Saddlebrooke, AZ
Population 12,616
Tucson Estates, AZ
Population 12,687
Catalina, AZ
Population 6,908
Drexel Heights, AZ
Population 27,636
Picture Rocks, AZ
Population 9,665
Flowing Wells, AZ
Population 16,989
Oro Valley Demographics And Statistics
Population over time in Oro Valley
The current population in Oro Valley is 47,595. The population has increased 19.7% from 2010.
| Year | Population | % Change |
|---|---|---|
| 2023 | 47,595 | 1.2% |
| 2022 | 47,053 | 1.2% |
| 2021 | 46,515 | 2.7% |
| 2020 | 45,303 | 1.5% |
| 2019 | 44,630 | 1.9% |
| 2018 | 43,815 | 2.2% |
| 2017 | 42,889 | 1.2% |
| 2016 | 42,379 | 1.0% |
| 2015 | 41,965 | 1.1% |
| 2014 | 41,493 | 0.7% |
| 2013 | 41,209 | 0.9% |
| 2012 | 40,857 | 1.1% |
| 2011 | 40,422 | 1.6% |
| 2010 | 39,776 | - |
Race / Ethnicity in Oro Valley
Oro Valley is:
76.3% White with 36,302 White residents.
1.4% African American with 650 African American residents.
0.1% American Indian with 36 American Indian residents.
3.6% Asian with 1,736 Asian residents.
0.1% Hawaiian with 46 Hawaiian residents.
0.3% Other with 166 Other residents.
3.6% Two Or More with 1,719 Two Or More residents.
14.6% Hispanic with 6,940 Hispanic residents.
| Race | Oro Valley | AZ | USA |
|---|---|---|---|
| White | 76.3% | 53.4% | 58.2% |
| African American | 1.4% | 4.4% | 12.0% |
| American Indian | 0.1% | 3.4% | 0.5% |
| Asian | 3.6% | 3.3% | 5.7% |
| Hawaiian | 0.1% | 0.2% | 0.2% |
| Other | 0.3% | 0.4% | 0.5% |
| Two Or More | 3.6% | 3.9% | 3.9% |
| Hispanic | 14.6% | 31.0% | 19.0% |
Gender in Oro Valley
Oro Valley is 52.7% female with 25,079 female residents.
Oro Valley is 47.3% male with 22,516 male residents.
| Gender | Oro Valley | AZ | USA |
|---|---|---|---|
| Female | 52.7% | 50.1% | 50.5% |
| Male | 47.3% | 49.9% | 49.5% |
Highest level of educational attainment in Oro Valley for adults over 25
1.0% of adults in Oro Valley completed < 9th grade.
2.0% of adults in Oro Valley completed 9-12th grade.
12.0% of adults in Oro Valley completed high school / ged.
19.0% of adults in Oro Valley completed some college.
9.0% of adults in Oro Valley completed associate's degree.
32.0% of adults in Oro Valley completed bachelor's degree.
17.0% of adults in Oro Valley completed master's degree.
4.0% of adults in Oro Valley completed professional degree.
4.0% of adults in Oro Valley completed doctorate degree.
| Education | Oro Valley | AZ | USA |
|---|---|---|---|
| < 9th Grade | 1.0% | 6.0% | 5.0% |
| 9-12th Grade | 2.0% | 6.0% | 6.0% |
| High School / GED | 12.0% | 23.0% | 26.0% |
| Some College | 19.0% | 24.0% | 19.0% |
| Associate's Degree | 9.0% | 9.0% | 9.0% |
| Bachelor's Degree | 32.0% | 20.0% | 21.0% |
| Master's Degree | 17.0% | 9.0% | 10.0% |
| Professional Degree | 4.0% | 2.0% | 2.0% |
| Doctorate Degree | 4.0% | 1.0% | 2.0% |
Household Income For Oro Valley, Arizona
3.6% of households in Oro Valley earn Less than $10,000.
1.7% of households in Oro Valley earn $10,000 to $14,999.
3.6% of households in Oro Valley earn $15,000 to $24,999.
4.5% of households in Oro Valley earn $25,000 to $34,999.
7.8% of households in Oro Valley earn $35,000 to $49,999.
13.1% of households in Oro Valley earn $50,000 to $74,999.
12.8% of households in Oro Valley earn $75,000 to $99,999.
23.5% of households in Oro Valley earn $100,000 to $149,999.
12.5% of households in Oro Valley earn $150,000 to $199,999.
16.9% of households in Oro Valley earn $200,000 or more.
| Income | Oro Valley | AZ | USA |
|---|---|---|---|
| Less than $10,000 | 3.6% | 4.9% | 4.9% |
| $10,000 to $14,999 | 1.7% | 2.9% | 3.6% |
| $15,000 to $24,999 | 3.6% | 6.1% | 6.6% |
| $25,000 to $34,999 | 4.5% | 6.9% | 6.8% |
| $35,000 to $49,999 | 7.8% | 10.9% | 10.4% |
| $50,000 to $74,999 | 13.1% | 17.0% | 15.7% |
| $75,000 to $99,999 | 12.8% | 13.6% | 12.7% |
| $100,000 to $149,999 | 23.5% | 18.1% | 17.4% |
| $150,000 to $199,999 | 12.5% | 9.0% | 9.3% |
| $200,000 or more | 16.9% | 10.6% | 12.6% |


