Sahuarita SnackAbility
Overall SnackAbility
Crime in Sahuarita summary. We use data from the FBI to determine the crime rates in Sahuarita. Key points include:
There were 396 total crimes in Sahuarita in the last reporting year.
The overall crime rate per 100,000 people in Sahuarita is 1,068.9 / 100k people.
The violent crime rate per 100,000 people in Sahuarita is 91.8 / 100k people.
The property crime rate per 100,000 people in Sahuarita is 977.1 / 100k people.
Overall, crime in Sahuarita is -49.56% below the national average.
Total Crimes
Below National Average
Crime In Sahuarita Comparison Table
| Statistic | Count Raw |
Sahuarita / 100k People |
Arizona / 100k People |
National / 100k People |
|---|---|---|---|---|
| Total Crimes Per 100K | 396 | 1,068.9 | 2,214.0 | 2,119.2 |
| Violent Crime | 34 | 91.8 | 421.9 | 359.0 |
| Murder | 2 | 5.4 | 4.9 | 5.0 |
| Robbery | 1 | 2.7 | 64.6 | 61.0 |
| Aggravated Assault | 24 | 64.8 | 312.4 | 256.0 |
| Property Crime | 362 | 977.1 | 1,792.1 | 1,760.0 |
| Burglary | 30 | 81.0 | 217.8 | 229.0 |
| Larceny | 317 | 855.6 | 1,329.9 | 1,272.0 |
| Car Theft | 15 | 40.5 | 244.4 | 259.0 |
Source: FBI Uniform Crime Reporting (2024)
Cost of living in Sahuarita summary. We use data on the cost of living to determine how expensive it is to live in Sahuarita. Real estate prices drive most of the variance in cost of living around Arizona. Key points include:
The cost of living in Sahuarita is 111 with 100 being average.
The cost of living in Sahuarita is 1.1x higher than the national average.
The median home value in Sahuarita is $353,394.
The median income in Sahuarita is $104,680.
Sahuarita's Overall Cost Of Living
Higher Than The National Average
Cost Of Living In Sahuarita Comparison Table
| Living Expense | Sahuarita | Arizona | National Average |
|---|---|---|---|
| Overall | 111 | 100 | 100 |
| Services | 102 | 99 | 100 |
| Groceries | 99 | 99 | 100 |
| Health | 137 | 97 | 100 |
| Housing | 102 | 104 | 100 |
| Transportation | 112 | 113 | 100 |
| Utilities | 102 | 104 | 100 |
Source: Cost of living index, normalized to US average = 100
Sahuarita, AZ Weather
The average high in Sahuarita is 83.2° and the average low is 54.0°.
There are 30.8 days of precipitation each year.
Expect an average of 12.8 inches of precipitation each year with 0.7 inches of snow.
| Stat | Sahuarita |
|---|---|
| Average Annual High | 83.2 |
| Average Annual Low | 54.0 |
| Annual Precipitation Days | 30.8 |
| Average Annual Precipitation | 12.8 |
| Average Annual Snowfall | 0.7 |
Average High
Days of Rain
Source: NOAA climate normals (30-year)
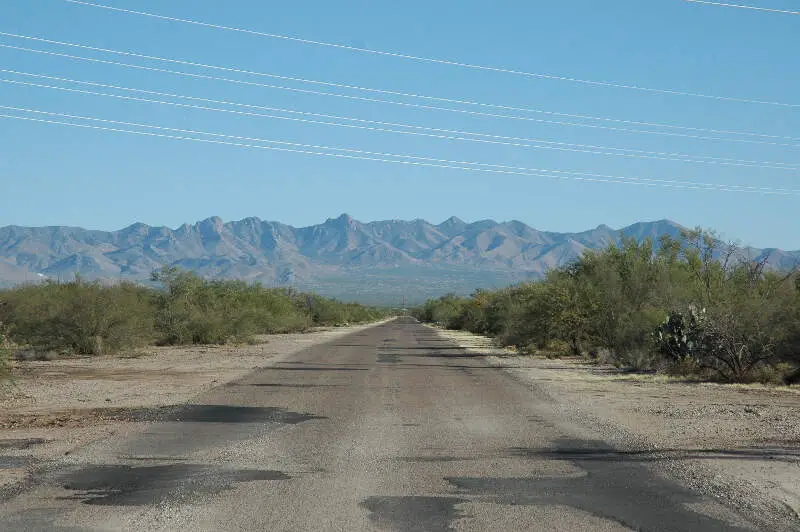
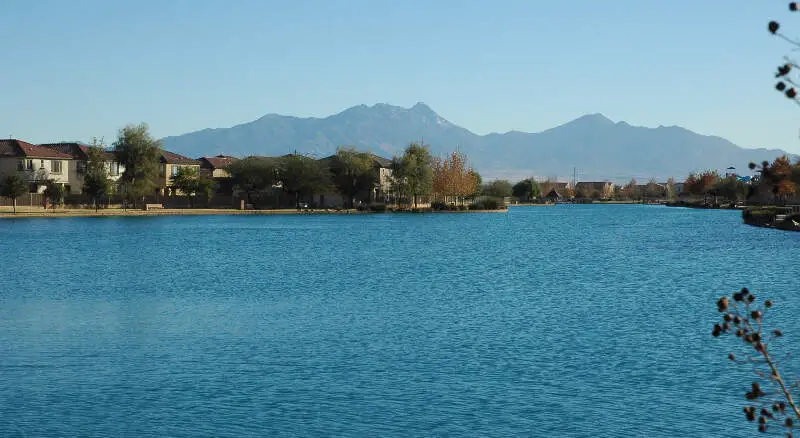
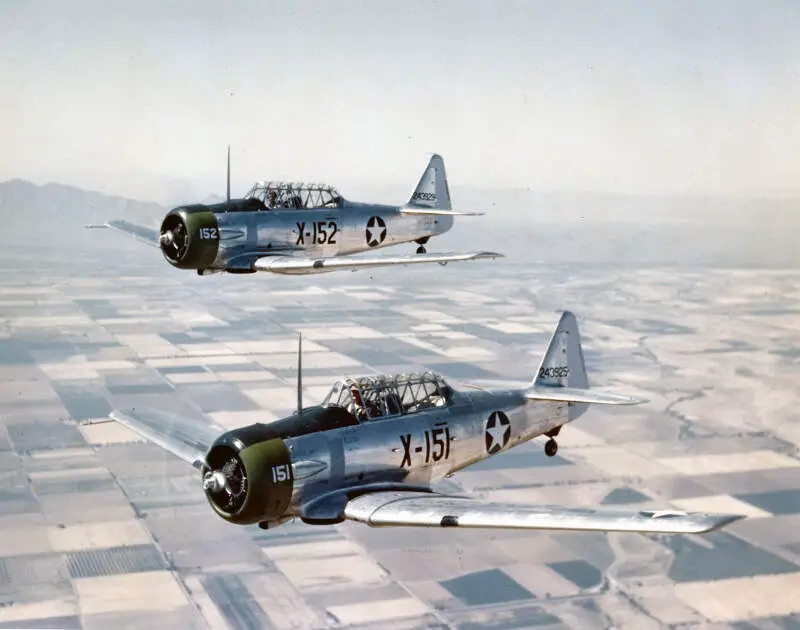
Sahuarita, AZ Photos

Rankings & Articles For Sahuarita


Locations Around Sahuarita
Map Of Sahuarita, AZ
Best Places Around Sahuarita
Corona de Tucson, AZ
Population 9,566
Vail, AZ
Population 16,315
Green Valley, AZ
Population 22,114
Tucson Estates, AZ
Population 12,136
Valencia West, AZ
Population 14,728
Drexel Heights, AZ
Population 27,675
Tucson, AZ
Population 547,073
South Tucson, AZ
Population 4,550
Sahuarita Demographics And Statistics
Population over time in Sahuarita
The current population in Sahuarita is 35,862. The population has increased 66.0% from 2010.
| Year | Population | % Change |
|---|---|---|
| 2024 | 35,862 | 2.4% |
| 2023 | 35,012 | 2.3% |
| 2022 | 34,238 | 2.1% |
| 2021 | 33,524 | 9.3% |
| 2020 | 30,679 | 2.6% |
| 2019 | 29,905 | 3.3% |
| 2018 | 28,949 | 2.4% |
| 2017 | 28,257 | 1.7% |
| 2016 | 27,780 | 9.2% |
| 2015 | 25,430 | -3.8% |
| 2014 | 26,441 | 3.0% |
| 2013 | 25,669 | 4.2% |
| 2012 | 24,643 | 6.2% |
| 2011 | 23,215 | 7.4% |
| 2010 | 21,607 | - |
Race / Ethnicity in Sahuarita
See the full breakdown
Sahuarita is:
52.5% White with 18,821 White residents.
3.2% African American with 1,156 African American residents.
0.1% American Indian with 37 American Indian residents.
1.2% Asian with 414 Asian residents.
0.3% Hawaiian with 105 Hawaiian residents.
0.6% Other with 212 Other residents.
3.1% Two Or More with 1,106 Two Or More residents.
39.1% Hispanic with 14,011 Hispanic residents.
| Race | Sahuarita | AZ | USA |
|---|---|---|---|
| White | 52.5% | 52.6% | 57.4% |
| African American | 3.2% | 4.4% | 11.9% |
| American Indian | 0.1% | 3.2% | 0.5% |
| Asian | 1.2% | 3.5% | 5.9% |
| Hawaiian | 0.3% | 0.2% | 0.2% |
| Other | 0.6% | 0.5% | 0.6% |
| Two Or More | 3.1% | 4.4% | 4.3% |
| Hispanic | 39.1% | 31.4% | 19.3% |
Gender in Sahuarita
See the full breakdown
Sahuarita is 50.7% female with 18,182 female residents.
Sahuarita is 49.3% male with 17,680 male residents.
| Gender | Sahuarita | AZ | USA |
|---|---|---|---|
| Female | 50.7% | 50.1% | 50.5% |
| Male | 49.3% | 49.9% | 49.5% |
Highest level of educational attainment in Sahuarita for adults over 25
See the full breakdown
-1.0% of adults in Sahuarita completed < 9th grade.
4.0% of adults in Sahuarita completed 9-12th grade.
17.0% of adults in Sahuarita completed high school / ged.
23.0% of adults in Sahuarita completed some college.
12.0% of adults in Sahuarita completed associate's degree.
27.0% of adults in Sahuarita completed bachelor's degree.
14.0% of adults in Sahuarita completed master's degree.
2.0% of adults in Sahuarita completed professional degree.
2.0% of adults in Sahuarita completed doctorate degree.
| Education | Sahuarita | AZ | USA |
|---|---|---|---|
| < 9th Grade | -1.0% | 6.0% | 4.0% |
| 9-12th Grade | 4.0% | 6.0% | 6.0% |
| High School / GED | 17.0% | 23.0% | 26.0% |
| Some College | 23.0% | 23.0% | 19.0% |
| Associate's Degree | 12.0% | 9.0% | 9.0% |
| Bachelor's Degree | 27.0% | 20.0% | 22.0% |
| Master's Degree | 14.0% | 9.0% | 10.0% |
| Professional Degree | 2.0% | 2.0% | 2.0% |
| Doctorate Degree | 2.0% | 2.0% | 2.0% |
Household Income For Sahuarita, Arizona
See the full breakdown
2.4% of households in Sahuarita earn Less than $10,000.
0.9% of households in Sahuarita earn $10,000 to $14,999.
3.1% of households in Sahuarita earn $15,000 to $24,999.
4.2% of households in Sahuarita earn $25,000 to $34,999.
11.6% of households in Sahuarita earn $35,000 to $49,999.
13.2% of households in Sahuarita earn $50,000 to $74,999.
12.1% of households in Sahuarita earn $75,000 to $99,999.
25.3% of households in Sahuarita earn $100,000 to $149,999.
13.4% of households in Sahuarita earn $150,000 to $199,999.
13.7% of households in Sahuarita earn $200,000 or more.
| Income | Sahuarita | AZ | USA |
|---|---|---|---|
| Less than $10,000 | 2.4% | 5.0% | 5.0% |
| $10,000 to $14,999 | 0.9% | 2.7% | 3.4% |
| $15,000 to $24,999 | 3.1% | 5.8% | 6.3% |
| $25,000 to $34,999 | 4.2% | 6.6% | 6.6% |
| $35,000 to $49,999 | 11.6% | 10.5% | 10.1% |
| $50,000 to $74,999 | 13.2% | 16.5% | 15.5% |
| $75,000 to $99,999 | 12.1% | 13.5% | 12.6% |
| $100,000 to $149,999 | 25.3% | 18.4% | 17.5% |
| $150,000 to $199,999 | 13.4% | 9.4% | 9.6% |
| $200,000 or more | 13.7% | 11.6% | 13.4% |
Source: U.S. Census ACS 5-year estimates (2024)


