
Some of you might be asking yourself, at this very moment, is Arkansas a good place?
The answer is unequivocally yes… if you know where to locate the best counties to live in Arkansas.
Lucky for you, we’re here to help you identify the best counties to live in the Natural State based on the most recently available data from the Census. And this isn’t our first rodeo — we’ve been using Saturday Night Science to rank places for years.
The question becomes if you wanted to relocate to the best part of Arkansas, where would you go? To answer that, we looked at crime, cost of living, and demographic data for all 75 counties in the state.
Table Of Contents: Top Ten | Methodology | Table | FAQs | Summary
The 10 Best Counties To Live In Arkansas For 2026
Saline County is the county to be when it comes to living the good life in Arkansas. And you should avoid Chicot County if you can — at least according to the data.
Now you know exactly where to move in Arkansas. Keep on reading for more about the top ten and a detailed methodology.
Or, check out the best places to live in Arkansas and the cheapest places to live in Arkansas.
Table Of Contents: Top Ten | Methodology | Summary | Table
The Best Counties To Live In Arkansas For 2026
1. Saline County
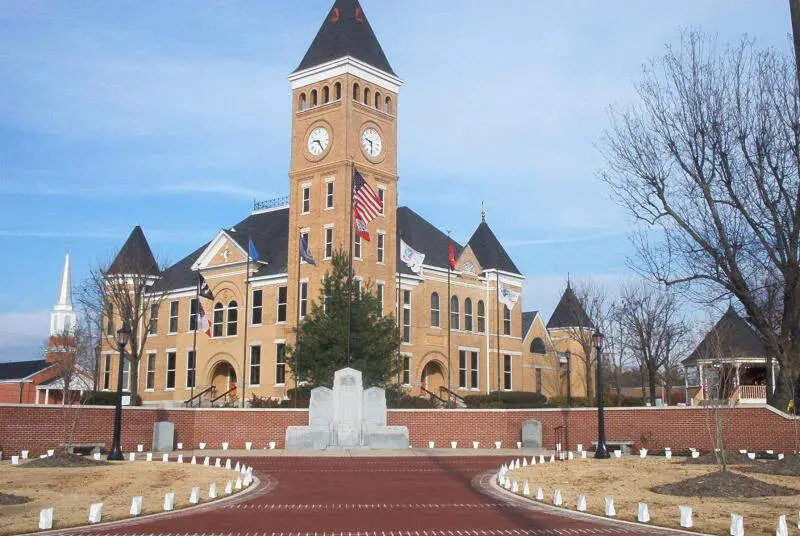
Biggest Place: Benton
Population: 127,479
Median Income: $79,046 (2nd best)
Median Home Price: $253,064 (6th best)
Unemployment Rate: 3.9% (17th best)
More on Saline County: Data
2. Faulkner County
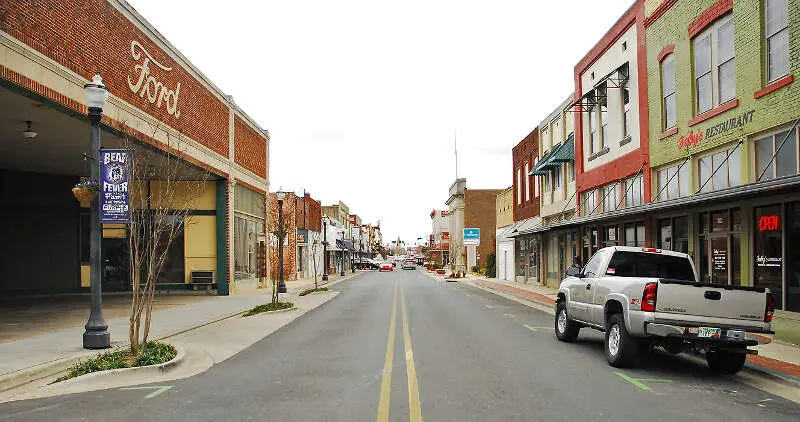
Biggest Place: Conway
Population: 127,717
Median Income: $67,289 (6th best)
Median Home Price: $250,363 (7th best)
Unemployment Rate: 3.4% (9th best)
More on Faulkner County: Data
3. Lonoke County
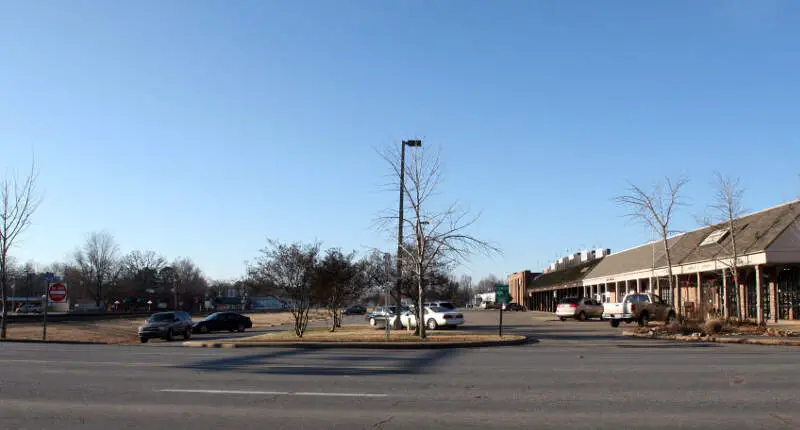
Biggest Place: Cabot
Population: 75,272
Median Income: $72,828 (3rd best)
Median Home Price: $229,578 (9th best)
Unemployment Rate: 4.4% (2best)
More on Lonoke County: Data
4. Benton County
Biggest Place: Springdale
Population: 303,632
Median Income: $93,506 (best)
Median Home Price: $385,660 (best)
Unemployment Rate: 3.1% (5th best)
More on Benton County: Data
5. Grant County

Biggest Place: Sheridan
Population: 18,242
Median Income: $71,549 (4th best)
Median Home Price: $210,726 (17th best)
Unemployment Rate: 4.5% (22nd best)
More on Grant County: Data
6. Boone County
Biggest Place: Harrison
Population: 38,138
Median Income: $55,143 (27th best)
Median Home Price: $226,496 (11th best)
Unemployment Rate: 2.5% (2nd best)
More on Boone County: Data
7. Cleveland County
Biggest Place: Rison
Population: 7,453
Median Income: $54,794 (28th best)
Median Home Price: $156,930 (42nd best)
Unemployment Rate: 2.2% (best)
More on Cleveland County: Data
8. Hot Spring County
Biggest Place: Malvern
Population: 33,180
Median Income: $55,405 (22nd best)
Median Home Price: $161,661 (40th best)
Unemployment Rate: 3.7% (12th best)
More on Hot Spring County: Data
9. Pope County

Biggest Place: Russellville
Population: 64,131
Median Income: $57,344 (14th best)
Median Home Price: $208,275 (18th best)
Unemployment Rate: 5.1% (32nd best)
More on Pope County: Data
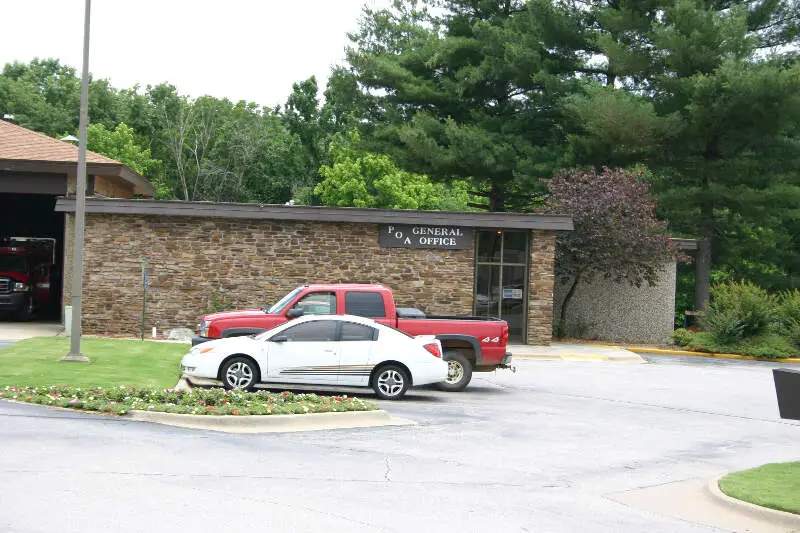
10. Cleburne County
Biggest Place: Heber Springs
Population: 25,226
Median Income: $55,798 (20th best)
Median Home Price: $254,451 (5th best)
Unemployment Rate: 6.4% (56th best)
More on Cleburne County: Data
Methodology: How do you determine which Arkansas county is the best?
To give you the best county in Arkansas, we have to look at a handful of metrics that signal the quality of a place. To do that, we made assumptions about what’s in a “best county” and what isn’t. For reference, we are trying to make the kind of argument you’d make at a bar using facts, Saturday Night Science.
With that in mind, we went to two of the best data sources on the internet. Namely, the American Community Survey data and FBI Crime data for the most recent period.
We paid particular attention to:
- Violent Crime Rates
- Property Crime Rates
- Median Home Values
- Median Income
- Unemployment Rates
- Adult Education Levels
- Health Insurance Coverage
- Poverty Rates
We then ranked each county in Arkansas across each of the criteria from one to 75, with one being the best.
Taking the average rank across all criteria, we created a quality of life score with the county posting the lowest overall score being the “Best County To Live In Arkansas.”
The result is some of the safest, quietest, and best counties to raise a family in the Natural State.
We updated this article for 2026. This report is our eleventh time ranking the best counties to live in Arkansas.
Read on to see why Saline County is the best county, while Chicot County is probably in contention for being the worst county in Arkansas.
Summary: The Best Counties In Arkansas To Call Home For 2026
Living in Arkansas can vary from one part of the state to the next — who woulda thought?
The best counties in Arkansas are Saline County, Faulkner County, Lonoke County, Benton County, Grant County, Boone County, Cleveland County, Hot Spring County, Pope County, and Cleburne County.
But now you know the outstanding parts and the parts to avoid, and that’s why you came here to learn at the end of the day.
You are welcome.
Here’s a look at the worst counties in Arkansas according to the data:
- Chicot County
- Phillips County
- Desha County
For more Arkansas reading, check out:
- Best Counties To Live In Arkansas
- Best Places To Buy A House In Arkansas
- Cheapest Places To Live In Arkansas
- Best Places To Raise A Family In Arkansas
Detailed List Of The Best Counties In Arkansas
| Rank | County | Population | Median Income | Median Home Price |
|---|---|---|---|---|
| 1 | Saline County | 127,479 | $79,046 | $253,064 |
| 2 | Faulkner County | 127,717 | $67,289 | $250,363 |
| 3 | Lonoke County | 75,272 | $72,828 | $229,578 |
| 4 | Benton County | 303,632 | $93,506 | $385,660 |
| 5 | Grant County | 18,242 | $71,549 | $210,726 |
| 6 | Boone County | 38,138 | $55,143 | $226,496 |
| 7 | Cleveland County | 7,453 | $54,794 | $156,930 |
| 8 | Hot Spring County | 33,180 | $55,405 | $161,661 |
| 9 | Pope County | 64,131 | $57,344 | $208,275 |
| 10 | Cleburne County | 25,226 | $55,798 | $254,451 |
| 11 | Prairie County | 8,064 | $51,646 | $150,730 |
| 12 | Washington County | 256,765 | $70,639 | $350,006 |
| 13 | Crawford County | 61,139 | $64,132 | $216,287 |
| 14 | Pulaski County | 399,818 | $62,873 | $207,636 |
| 15 | Calhoun County | 4,704 | $66,809 | $135,955 |
| 16 | Garland County | 100,035 | $57,181 | $244,727 |
| 17 | Logan County | 21,277 | $58,555 | $160,525 |
| 18 | Perry County | 10,101 | $55,764 | $178,832 |
| 19 | Craighead County | 113,249 | $59,548 | $214,721 |
| 20 | Baxter County | 42,407 | $48,452 | $229,075 |
| 21 | Little River County | 11,821 | $53,344 | $150,019 |
| 22 | Newton County | 7,112 | $48,986 | $226,025 |
| 23 | Greene County | 46,432 | $57,839 | $190,016 |
| 24 | Madison County | 17,329 | $56,798 | $271,361 |
| 25 | Franklin County | 17,326 | $55,886 | $174,058 |
| 26 | Columbia County | 22,349 | $55,334 | $136,070 |
| 27 | Fulton County | 12,302 | $42,241 | $187,024 |
| 28 | Conway County | 21,054 | $54,187 | $167,505 |
| 29 | Van Buren County | 15,998 | $50,354 | $169,726 |
| 30 | Nevada County | 8,159 | $53,886 | $98,387 |
| 31 | Union County | 37,900 | $55,259 | $125,864 |
| 32 | Marion County | 17,228 | $48,619 | $216,707 |
| 33 | Yell County | 20,134 | $55,934 | $162,192 |
| 34 | Lincoln County | 12,950 | $51,778 | $127,671 |
| 35 | Stone County | 12,568 | $40,943 | $201,828 |
| 36 | Independence County | 38,175 | $56,609 | $174,511 |
| 37 | Sebastian County | 128,900 | $57,790 | $202,236 |
| 38 | Carroll County | 28,626 | $54,230 | $266,461 |
| 39 | White County | 77,838 | $55,249 | $203,387 |
| 40 | Clark County | 21,125 | $52,034 | $163,297 |
| 41 | Ouachita County | 22,085 | $49,268 | $97,481 |
| 42 | Jefferson County | 64,802 | $51,096 | $86,903 |
| 43 | Johnson County | 26,003 | $45,995 | $184,396 |
| 44 | Polk County | 19,361 | $49,191 | $186,264 |
| 45 | Pike County | 10,115 | $49,269 | $176,792 |
| 46 | Dallas County | 6,242 | $42,500 | $103,786 |
| 47 | Montgomery County | 8,553 | $48,906 | $216,048 |
| 48 | Searcy County | 7,859 | $44,426 | $183,761 |
| 49 | Randolph County | 18,838 | $50,911 | $139,859 |
| 50 | Drew County | 17,046 | $42,824 | $156,682 |
| 51 | Sharp County | 17,773 | $44,637 | $149,314 |
| 52 | Clay County | 14,280 | $51,481 | $115,634 |
| 53 | Sevier County | 15,712 | $53,527 | $168,693 |
| 54 | Crittenden County | 47,266 | $55,358 | $164,981 |
| 55 | Howard County | 12,583 | $45,603 | $156,006 |
| 56 | Izard County | 14,009 | $49,405 | $174,048 |
| 57 | Mississippi County | 39,126 | $52,548 | $110,694 |
| 58 | Cross County | 16,543 | $50,863 | $135,621 |
| 59 | Arkansas County | 16,515 | $53,164 | $119,177 |
| 60 | Hempstead County | 19,508 | $46,787 | $119,192 |
| 61 | Ashley County | 18,429 | $44,266 | $83,337 |
| 62 | Miller County | 42,360 | $48,836 | $169,883 |
| 63 | Poinsett County | 22,543 | $46,707 | $128,400 |
| 64 | Scott County | 9,816 | $43,270 | $149,974 |
| 65 | Woodruff County | 6,026 | $48,158 | $81,170 |
| 66 | Lawrence County | 16,238 | $44,882 | $125,437 |
| 67 | Lafayette County | 6,136 | $41,278 | $95,392 |
| 68 | St. Francis County | 22,400 | $42,574 | $107,363 |
| 69 | Bradley County | 10,208 | $41,476 | $103,457 |
| 70 | Monroe County | 6,589 | $43,214 | $84,697 |
| 71 | Jackson County | 16,712 | $44,218 | $90,291 |
| 72 | Lee County | 8,359 | $34,375 | $100,712 |
| 73 | Desha County | 10,786 | $37,662 | $94,488 |
| 74 | Phillips County | 15,450 | $40,134 | $50,141 |
| 75 | Chicot County | 9,765 | $39,045 | $99,829 |