100 Biggest Cities In Arkansas For 2023
Using the latest Census data, we detail the 100 biggest cities in Arkansas. You can all see a comprehensive list of all 207 cities and places in Arkansas.

We all love the biggest cities that the Natural State has to offer. You know the places like Little Rock and Fayetteville which make all the headlines.
But there are a bunch of other great large cities in Arkansas that don't get as much love.
We're going to change that right now.
Using the most recent Census data, we can tell you about all the places in Arkansas with a focus on the biggest. We update the data each year and this is our fourth time doing this.
Table Of Contents: Top Ten | Methodology | Table
The Largest Cities In Arkansas For 2023:
You can click here to see a full table of the full of the 100 biggest cities in Arkansas, along with every other place over 1,000 people big. It is sortable by clicking on the headers.
Read on below to see more on the biggest cities. Or for more reading on places to live in Arkansas, check out:
- Best Places To Live In Arkansas
- Cheapest Places To Live In Arkansas
- Most Dangerous Places in Arkansas
The 10 Biggest Cities In Arkansas
/10
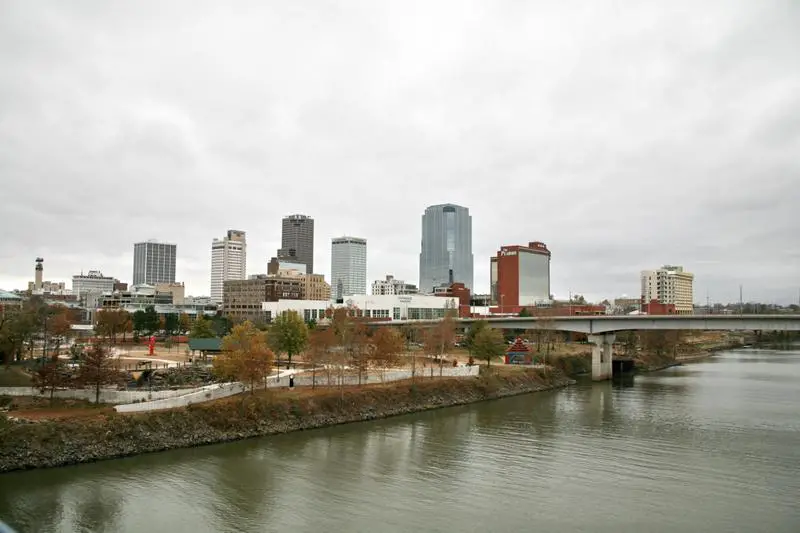
Rank Last Year: 1 (No Change)
Population: 201,893
Population 2010: 190,718
Growth: 5.9%
More on Little Rock: Data | Crime | Cost Of Living | Real Estate

/10
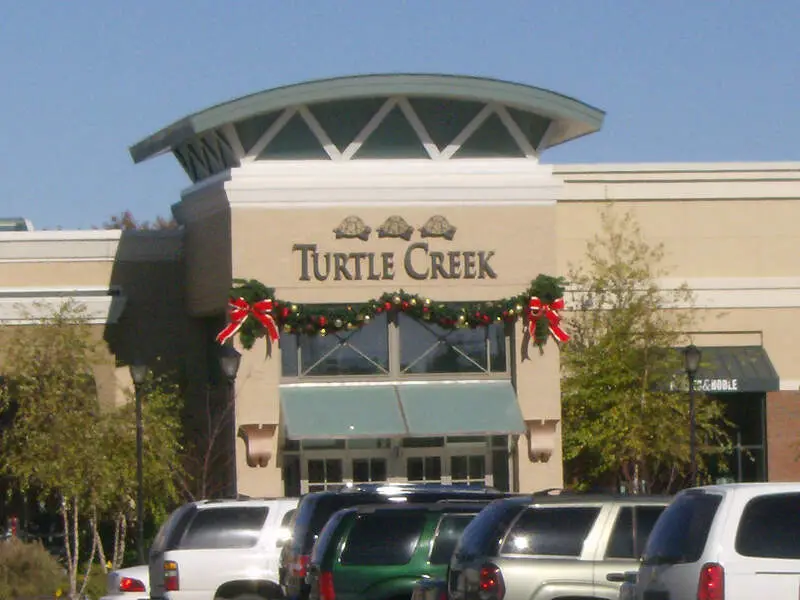
Rank Last Year: 3 (Up 1)
Population: 92,070
Population 2010: 71,770
Growth: 28.3%
More on Fayetteville: Data | Crime | Cost Of Living | Real Estate
/10
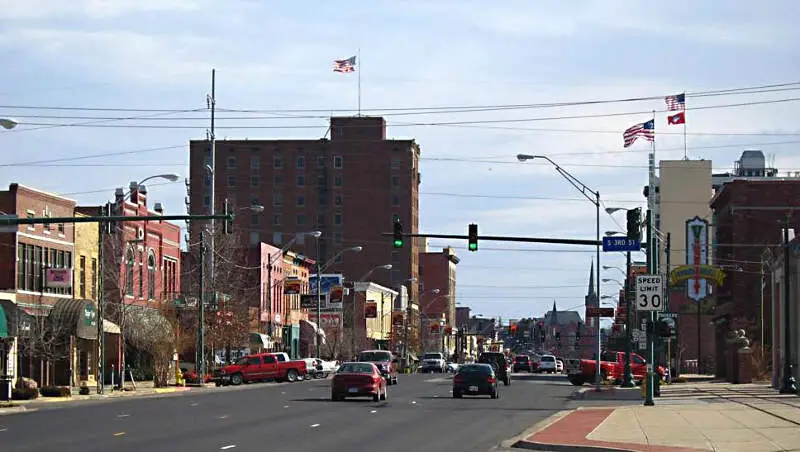
Rank Last Year: 2 (Down 1)
Population: 89,116
Population 2010: 85,200
Growth: 4.6%
More on Fort Smith: Data | Crime | Cost Of Living | Real Estate
/10
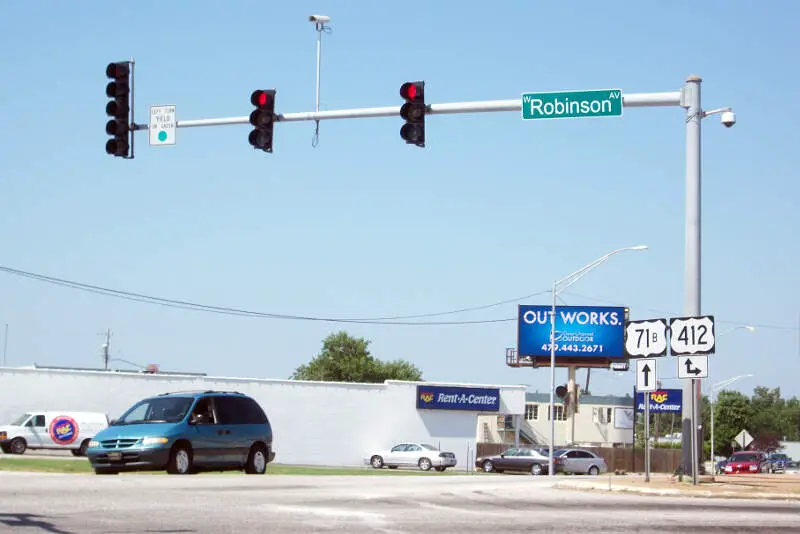
Rank Last Year: 4 (No Change)
Population: 85,887
Population 2010: 66,461
Growth: 29.2%
More on Springdale: Data | Crime | Cost Of Living | Real Estate
/10
Rank Last Year: 5 (No Change)
Population: 77,520
Population 2010: 64,798
Growth: 19.6%
More on Jonesboro: Data | Crime | Cost Of Living | Real Estate
/10
Rank Last Year: 6 (No Change)
Population: 68,340
Population 2010: 53,207
Growth: 28.4%
More on Rogers: Data | Crime | Cost Of Living | Real Estate
/10
Rank Last Year: 8 (Up 1)
Population: 64,444
Population 2010: 61,698
Growth: 4.5%
More on North Little Rock: Data | Crime | Cost Of Living | Real Estate
/10
Rank Last Year: 7 (Down 1)
Population: 63,746
Population 2010: 56,255
Growth: 13.3%
More on Conway: Data | Crime | Cost Of Living | Real Estate
/10
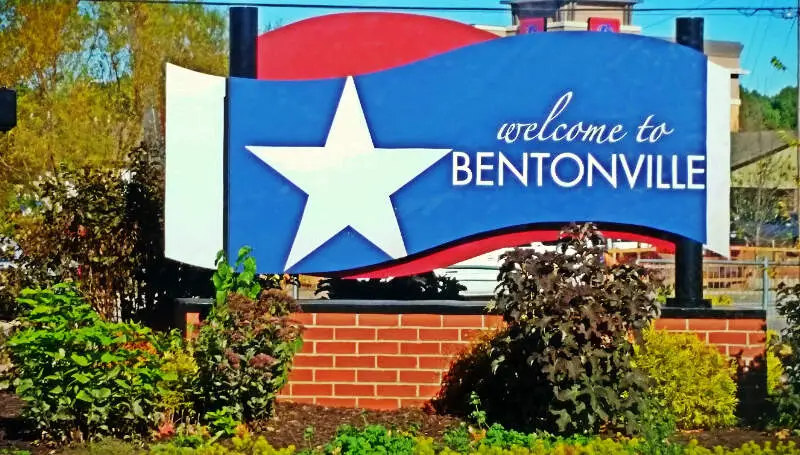
Rank Last Year: 9 (No Change)
Population: 52,565
Population 2010: 32,685
Growth: 60.8%
More on Bentonville: Data | Crime | Cost Of Living | Real Estate
/10
Rank Last Year: 10 (No Change)
Population: 41,964
Population 2010: 50,039
Growth: -16.1%
More on Pine Bluff: Data | Crime | Cost Of Living | Real Estate
How We Determined The Largest Cities In Arkansas
We've been ranking and dissecting cities in the Natural State for over 4 years now -- making this actually the fourth time we've run the numbers. We always use the best data, the US Census. In this case, that means we are using the American Community Survey.
It what is probably the most simple analysis we run each year, we ranked every place in Arkansas from biggest to smallest. The biggest city this year? That would be Little Rock.
The smallest? Cotter, although there are places smaller than 1,000 people not listed here, so keep that in mind as we take a look at the top ten.
Now on to numbers 11-100 Biggest in Arkansas
We hope that you find the big city, or really any city, that's right for you. Below is a list of the rest of the biggest cities along with every other place in Arkansas.
Have fun snacking around in the Natural State!
For more reading on Arkansas, check out:
- Best Places To Raise A Family In Arkansas
- Best Places To Retire In Arkansas
- Richest Cities In Arkansas
- Safest Places In Arkansas
- Worst Places To Live In Arkansas
- Most Expensive Places To Live In Arkansas
Detailed List Of The Biggest Cities In Arkansas
| Rank | City | Current Population | 2010 | Growth | |||||
|---|---|---|---|---|---|---|---|---|---|
| 1 | Little Rock | 201,893 | 190,718 | 5.9% | |||||
| 2 | Fayetteville | 92,070 | 71,770 | 28.3% | |||||
| 3 | Fort Smith | 89,116 | 85,200 | 4.6% | |||||
| 4 | Springdale | 85,887 | 66,461 | 29.2% | |||||
| 5 | Jonesboro | 77,520 | 64,798 | 19.6% | |||||
| 6 | Rogers | 68,340 | 53,207 | 28.4% | |||||
| 7 | North Little Rock | 64,444 | 61,698 | 4.5% | |||||
| 8 | Conway | 63,746 | 56,255 | 13.3% | |||||
| 9 | Bentonville | 52,565 | 32,685 | 60.8% | |||||
| 10 | Pine Bluff | 41,964 | 50,039 | -16.1% | |||||
| 11 | Hot Springs | 38,050 | 35,604 | 6.9% | |||||
| 12 | Benton | 34,746 | 29,118 | 19.3% | |||||
| 13 | Sherwood | 32,544 | 28,690 | 13.4% | |||||
| 14 | Texarkana | 29,492 | 29,787 | -1.0% | |||||
| 15 | Jacksonville | 29,385 | 28,498 | 3.1% | |||||
| 16 | Paragould | 29,327 | 25,422 | 15.4% | |||||
| 17 | Russellville | 29,057 | 27,300 | 6.4% | |||||
| 18 | Cabot | 26,411 | 22,333 | 18.3% | |||||
| 19 | West Memphis | 24,666 | 26,391 | -6.5% | |||||
| 20 | Van Buren | 23,213 | 22,236 | 4.4% | |||||
| 21 | Searcy | 23,074 | 22,128 | 4.3% | |||||
| 22 | Bryant | 20,399 | 15,757 | 29.5% | |||||
| 23 | Maumelle | 19,070 | 15,918 | 19.8% | |||||
| 24 | El Dorado | 17,800 | 19,278 | -7.7% | |||||
| 25 | Centerton | 17,455 | 8,314 | 109.9% | |||||
| 26 | Siloam Springs | 16,944 | 14,370 | 17.9% | |||||
| 27 | Hot Springs Village | 15,970 | 12,522 | 27.5% | |||||
| 28 | Marion | 13,624 | 11,693 | 16.5% | |||||
| 29 | Blytheville | 13,559 | 15,874 | -14.6% | |||||
| 30 | Forrest City | 13,372 | 15,174 | -11.9% | |||||
| 31 | Harrison | 13,081 | 12,928 | 1.2% | |||||
| 32 | Mountain Home | 12,722 | 12,345 | 3.1% | |||||
| 33 | Magnolia | 11,205 | 11,648 | -3.8% | |||||
| 34 | Batesville | 11,117 | 10,045 | 10.7% | |||||
| 35 | Camden | 10,644 | 12,246 | -13.1% | |||||
| 36 | Malvern | 10,626 | 10,273 | 3.4% | |||||
| 37 | Arkadelphia | 10,332 | 10,697 | -3.4% | |||||
| 38 | Helena-West Helena | 9,707 | 12,650 | -23.3% | |||||
| 39 | Lowell | 9,630 | 7,001 | 37.6% | |||||
| 40 | Greenwood | 9,498 | 8,634 | 10.0% | |||||
| 41 | Clarksville | 9,444 | 9,005 | 4.9% | |||||
| 42 | Hope | 9,010 | 10,204 | -11.7% | |||||
| 43 | Monticello | 8,567 | 9,441 | -9.3% | |||||
| 44 | Stuttgart | 8,363 | 9,400 | -11.0% | |||||
| 45 | Wynne | 8,352 | 8,408 | -0.7% | |||||
| 46 | Beebe | 8,343 | 6,978 | 19.6% | |||||
| 47 | Newport | 7,829 | 7,883 | -0.7% | |||||
| 48 | Farmington | 7,601 | 5,763 | 31.9% | |||||
| 49 | Trumann | 7,416 | 7,172 | 3.4% | |||||
| 50 | Pocahontas | 7,269 | 6,608 | 10.0% | |||||
| 51 | Osceola | 7,016 | 7,857 | -10.7% | |||||
| 52 | Heber Springs | 7,015 | 7,076 | -0.9% | |||||
| 53 | Morrilton | 6,948 | 6,723 | 3.3% | |||||
| 54 | Prairie Grove | 6,908 | 4,212 | 64.0% | |||||
| 55 | Pea Ridge | 6,491 | 4,414 | 47.1% | |||||
| 56 | East End | 6,432 | 6,797 | -5.4% | |||||
| 57 | De Queen | 6,192 | 6,409 | -3.4% | |||||
| 58 | Ward | 5,943 | 3,832 | 55.1% | |||||
| 59 | Alma | 5,806 | 5,245 | 10.7% | |||||
| 60 | Greenbrier | 5,683 | 4,405 | 29.0% | |||||
| 61 | Mena | 5,626 | 5,768 | -2.5% | |||||
| 62 | Berryville | 5,612 | 5,206 | 7.8% | |||||
| 63 | White Hall | 5,599 | 5,394 | 3.8% | |||||
| 64 | Warren | 5,485 | 6,064 | -9.5% | |||||
| 65 | Walnut Ridge | 5,392 | 4,882 | 10.4% | |||||
| 66 | Cave Springs | 5,224 | 1,447 | 261.0% | |||||
| 67 | Cherokee Village | 4,977 | 5,074 | -1.9% | |||||
| 68 | Sheridan | 4,908 | 4,691 | 4.6% | |||||
| 69 | Crossett | 4,888 | 5,585 | -12.5% | |||||
| 70 | Barling | 4,802 | 4,556 | 5.4% | |||||
| 71 | Piney | 4,744 | 4,417 | 7.4% | |||||
| 72 | Tontitown | 4,656 | 2,585 | 80.1% | |||||
| 73 | Dardanelle | 4,532 | 4,627 | -2.1% | |||||
| 74 | Shannon Hills | 4,365 | 2,939 | 48.5% | |||||
| 75 | Vilonia | 4,318 | 3,503 | 23.3% | |||||
| 76 | Rockwell | 4,297 | 3,815 | 12.6% | |||||
| 77 | Ashdown | 4,242 | 4,690 | -9.6% | |||||
| 78 | Nashville | 4,193 | 4,632 | -9.5% | |||||
| 79 | Lonoke | 4,181 | 4,282 | -2.4% | |||||
| 80 | Dumas | 4,059 | 4,772 | -14.9% | |||||
| 81 | Haskell | 4,006 | 3,733 | 7.3% | |||||
| 82 | Mcgehee | 3,895 | 4,278 | -9.0% | |||||
| 83 | Brookland | 3,884 | 1,538 | 152.5% | |||||
| 84 | Gibson | 3,863 | 3,388 | 14.0% | |||||
| 85 | Booneville | 3,828 | 4,045 | -5.4% | |||||
| 86 | Gentry | 3,816 | 3,054 | 25.0% | |||||
| 87 | Marianna | 3,660 | 4,241 | -13.7% | |||||
| 88 | Manila | 3,650 | 3,256 | 12.1% | |||||
| 89 | Piggott | 3,629 | 3,844 | -5.6% | |||||
| 90 | Johnson | 3,612 | 3,211 | 12.5% | |||||
| 91 | Elkins | 3,566 | 2,430 | 46.7% | |||||
| 92 | Ozark | 3,559 | 3,700 | -3.8% | |||||
| 93 | Fordyce | 3,516 | 4,384 | -19.8% | |||||
| 94 | Gravette | 3,514 | 2,012 | 74.7% | |||||
| 95 | Austin | 3,486 | 1,367 | 155.0% | |||||
| 96 | Landmark | 3,442 | 3,306 | 4.1% | |||||
| 97 | Alexander | 3,363 | 2,720 | 23.6% | |||||
| 98 | Waldron | 3,333 | 3,623 | -8.0% | |||||
| 99 | Paris | 3,254 | 3,593 | -9.4% | |||||
| 100 | Corning | 3,226 | 3,423 | -5.8% | |||||
| 101 | West Fork | 3,225 | 2,560 | 26.0% | |||||
| 102 | Pottsville | 3,098 | 2,690 | 15.2% | |||||
| 103 | Prescott | 3,076 | 3,358 | -8.4% | |||||
| 104 | Dewitt | 2,993 | 3,340 | -10.4% | |||||
| 105 | Green Forest | 2,983 | 2,751 | 8.4% | |||||
| 106 | Little Flock | 2,977 | 2,592 | 14.9% | |||||
| 107 | Gosnell | 2,965 | 3,573 | -17.0% | |||||
| 108 | Elm Springs | 2,908 | 1,968 | 47.8% | |||||
| 109 | Atkins | 2,869 | 2,981 | -3.8% | |||||
| 110 | Mountain View | 2,833 | 2,797 | 1.3% | |||||
| 111 | Huntsville | 2,809 | 2,314 | 21.4% | |||||
| 112 | North Crossett | 2,771 | 3,414 | -18.8% | |||||
| 113 | Brinkley | 2,742 | 3,324 | -17.5% | |||||
| 114 | Harrisburg | 2,700 | 2,251 | 19.9% | |||||
| 115 | Hamburg | 2,649 | 2,881 | -8.1% | |||||
| 116 | Hoxie | 2,618 | 2,768 | -5.4% | |||||
| 117 | Dermott | 2,584 | 2,354 | 9.8% | |||||
| 118 | Charleston | 2,582 | 2,751 | -6.1% | |||||
| 119 | Bald Knob | 2,564 | 2,945 | -12.9% | |||||
| 120 | Clinton | 2,525 | 2,675 | -5.6% | |||||
| 121 | England | 2,502 | 2,867 | -12.7% | |||||
| 122 | Goshen | 2,500 | 1,010 | 147.5% | |||||
| 123 | Lavaca | 2,443 | 2,238 | 9.2% | |||||
| 124 | Bono | 2,434 | 2,179 | 11.7% | |||||
| 125 | Horseshoe Bend | 2,432 | 2,477 | -1.8% | |||||
| 126 | Leachville | 2,383 | 2,330 | 2.3% | |||||
| 127 | Bay | 2,348 | 1,752 | 34.0% | |||||
| 128 | Dover | 2,342 | 1,446 | 62.0% | |||||
| 129 | Gassville | 2,324 | 2,165 | 7.3% | |||||
| 130 | Mayflower | 2,305 | 2,653 | -13.1% | |||||
| 131 | Cave City | 2,291 | 1,725 | 32.8% | |||||
| 132 | Carlisle | 2,282 | 2,400 | -4.9% | |||||
| 133 | Prairie Creek | 2,274 | 1,676 | 35.7% | |||||
| 134 | Lincoln | 2,269 | 2,233 | 1.6% | |||||
| 135 | Eudora | 2,251 | 2,341 | -3.8% | |||||
| 136 | Lake Village | 2,247 | 2,596 | -13.4% | |||||
| 137 | Salem | 2,238 | 2,671 | -16.2% | |||||
| 138 | Kensett | 2,207 | 1,616 | 36.6% | |||||
| 139 | Fairfield Bay | 2,190 | 2,041 | 7.3% | |||||
| 140 | Eureka Springs | 2,159 | 2,022 | 6.8% | |||||
| 141 | Judsonia | 2,150 | 1,960 | 9.7% | |||||
| 142 | Marked Tree | 2,144 | 2,597 | -17.4% | |||||
| 143 | Lake City | 2,122 | 2,105 | 0.8% | |||||
| 144 | Danville | 2,104 | 2,558 | -17.7% | |||||
| 145 | Gurdon | 2,051 | 2,613 | -21.5% | |||||
| 146 | Augusta | 2,024 | 2,381 | -15.0% | |||||
| 147 | Calico Rock | 2,001 | 1,702 | 17.6% | |||||
| 148 | Smackover | 2,000 | 2,032 | -1.6% | |||||
| 149 | Melbourne | 1,992 | 1,676 | 18.9% | |||||
| 150 | Star City | 1,948 | 2,928 | -33.5% | |||||
| 151 | Lake Hamilton | 1,947 | 1,925 | 1.1% | |||||
| 152 | Rector | 1,924 | 2,132 | -9.8% | |||||
| 153 | Earle | 1,888 | 2,504 | -24.6% | |||||
| 154 | Glenwood | 1,845 | 2,298 | -19.7% | |||||
| 155 | Murfreesboro | 1,800 | 1,862 | -3.3% | |||||
| 156 | Lepanto | 1,785 | 2,177 | -18.0% | |||||
| 157 | Tuckerman | 1,741 | 1,967 | -11.5% | |||||
| 158 | Hazen | 1,739 | 1,559 | 11.5% | |||||
| 159 | Mccrory | 1,729 | 1,984 | -12.9% | |||||
| 160 | Bull Shoals | 1,728 | 2,084 | -17.1% | |||||
| 161 | Cedarville | 1,597 | 1,803 | -11.4% | |||||
| 162 | Marmaduke | 1,581 | 1,107 | 42.8% | |||||
| 163 | Wrightsville | 1,565 | 2,020 | -22.5% | |||||
| 164 | Lamar | 1,535 | 2,212 | -30.6% | |||||
| 165 | Stamps | 1,530 | 2,194 | -30.3% | |||||
| 166 | Greenland | 1,516 | 1,101 | 37.7% | |||||
| 167 | Mulberry | 1,516 | 2,011 | -24.6% | |||||
| 168 | Clarendon | 1,480 | 1,592 | -7.0% | |||||
| 169 | Hampton | 1,470 | 1,664 | -11.7% | |||||
| 170 | Marshall | 1,421 | 1,765 | -19.5% | |||||
| 171 | Decatur | 1,416 | 1,224 | 15.7% | |||||
| 172 | Highfill | 1,404 | 442 | 217.6% | |||||
| 173 | Redfield | 1,352 | 1,043 | 29.6% | |||||
| 174 | Des Arc | 1,341 | 2,088 | -35.8% | |||||
| 175 | Waldo | 1,337 | 1,267 | 5.5% | |||||
| 176 | Perryville | 1,331 | 1,304 | 2.1% | |||||
| 177 | Mcalmont | 1,327 | 1,153 | 15.1% | |||||
| 178 | Kibler | 1,324 | 952 | 39.1% | |||||
| 179 | Newark | 1,321 | 1,287 | 2.6% | |||||
| 180 | Monette | 1,317 | 1,220 | 8.0% | |||||
| 181 | Flippin | 1,296 | 1,638 | -20.9% | |||||
| 182 | Ash Flat | 1,293 | 1,505 | -14.1% | |||||
| 183 | Sweet Home | 1,286 | 736 | 74.7% | |||||
| 184 | East Camden | 1,276 | 1,083 | 17.8% | |||||
| 185 | Oak Grove Heights | 1,274 | 794 | 60.5% | |||||
| 186 | Wooster | 1,246 | 771 | 61.6% | |||||
| 187 | Midway | 1,245 | 931 | 33.7% | |||||
| 188 | Avilla | 1,239 | 1,152 | 7.6% | |||||
| 189 | Caraway | 1,239 | 1,219 | 1.6% | |||||
| 190 | Marvell | 1,232 | 1,248 | -1.3% | |||||
| 191 | Swifton | 1,229 | 772 | 59.2% | |||||
| 192 | Mansfield | 1,228 | 1,195 | 2.8% | |||||
| 193 | Mount Ida | 1,218 | 1,163 | 4.7% | |||||
| 194 | Diaz | 1,213 | 1,770 | -31.5% | |||||
| 195 | West Crossett | 1,202 | 1,092 | 10.1% | |||||
| 196 | Yellville | 1,195 | 1,427 | -16.3% | |||||
| 197 | Highland | 1,185 | 1,018 | 16.4% | |||||
| 198 | Mammoth Spring | 1,173 | 1,208 | -2.9% | |||||
| 199 | Sulphur Springs | 1,173 | 1,416 | -17.2% | |||||
| 200 | Mineral Springs | 1,130 | 1,195 | -5.4% | |||||
| 201 | Foreman | 1,121 | 1,151 | -2.6% | |||||
| 202 | Wilson | 1,093 | 742 | 47.3% | |||||
| 203 | Wickes | 1,062 | 661 | 60.7% | |||||
| 204 | Luxora | 1,057 | 1,156 | -8.6% | |||||
| 205 | Roland | 1,053 | 1,062 | -0.8% | |||||
| 206 | Horatio | 1,024 | 1,262 | -18.9% | |||||
| 207 | Cotter | 1,019 | 906 | 12.5% | |||||