
Some of you might be asking yourself, at this very moment, is Indiana a good place?
The answer is unequivocally yes… if you know where to locate the best counties to live in Indiana.
Lucky for you, we’re here to help you identify the best counties to live in the Hoosier State based on the most recently available data from the Census. And this isn’t our first rodeo — we’ve been using Saturday Night Science to rank places for years.
The question becomes if you wanted to relocate to the best part of Indiana, where would you go? To answer that, we looked at crime, cost of living, and demographic data for all 92 counties in the state.
Table Of Contents: Top Ten | Methodology | Table | FAQs | Summary
The 10 Best Counties To Live In Indiana For 2026
Hamilton County is the county to be when it comes to living the good life in Indiana. And you should avoid Wayne County if you can — at least according to the data.
Now you know exactly where to move in Indiana. Keep on reading for more about the top ten and a detailed methodology.
Or, check out the best places to live in Indiana and the cheapest places to live in Indiana.
Table Of Contents: Top Ten | Methodology | Summary | Table
The Best Counties To Live In Indiana For 2026
1. Hamilton County

Biggest Place: Carmel
Population: 365,056
Median Income: $121,530 (best)
Median Home Price: $459,567 (best)
Unemployment Rate: 2.8% (19th best)
More on Hamilton County: Data
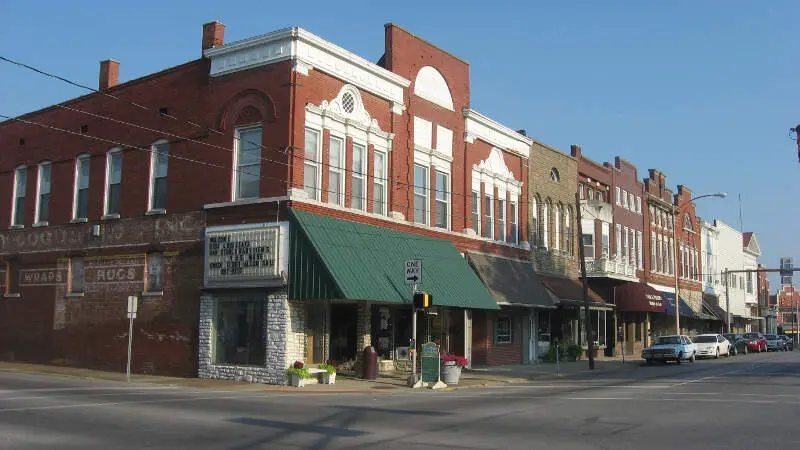
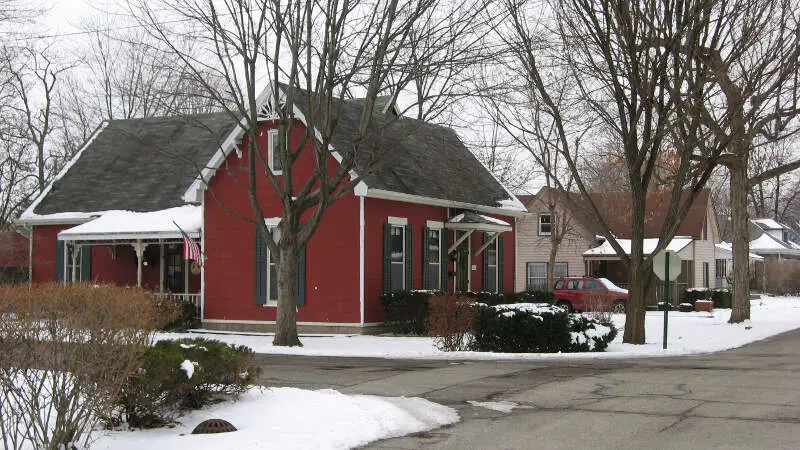
2. Boone County
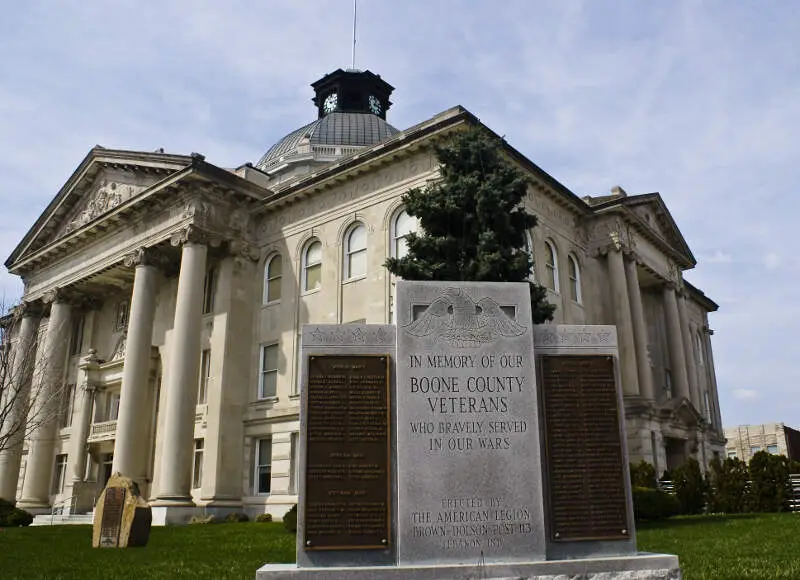
Biggest Place: Zionsville
Population: 74,718
Median Income: $111,250 (2nd best)
Median Home Price: $415,266 (2nd best)
Unemployment Rate: 2.8% (20th best)
More on Boone County: Data
3. Hendricks County

Biggest Place: Plainfield
Population: 183,344
Median Income: $101,144 (3rd best)
Median Home Price: $341,028 (4th best)
Unemployment Rate: 2.6% (11th best)
More on Hendricks County: Data
4. Warrick County
Biggest Place: Boonville
Population: 65,261
Median Income: $89,844 (6th best)
Median Home Price: $289,812 (16th best)
Unemployment Rate: 3.1% (29th best)
More on Warrick County: Data
5. Brown County
Biggest Place: Nashville
Population: 15,606
Median Income: $78,528 (14th best)
Median Home Price: $361,296 (3rd best)
Unemployment Rate: 2.2% (6th best)
More on Brown County: Data
6. Hancock County
Biggest Place: Greenfield
Population: 84,037
Median Income: $93,186 (4th best)
Median Home Price: $326,183 (7th best)
Unemployment Rate: 2.7% (17th best)
More on Hancock County: Data
7. Dearborn County
Biggest Place: Hidden Valley
Population: 51,094
Median Income: $84,735 (8th best)
Median Home Price: $326,619 (6th best)
Unemployment Rate: 1.9% (5th best)
More on Dearborn County: Data
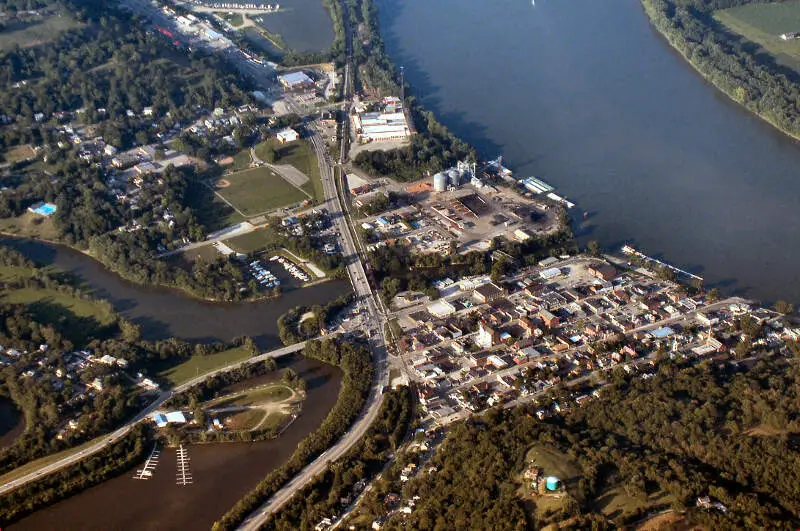
8. Posey County
Biggest Place: Mount Vernon
Population: 25,116
Median Income: $78,129 (16th best)
Median Home Price: $236,929 (38th best)
Unemployment Rate: 1.8% (3rd best)
More on Posey County: Data
9. Johnson County
Biggest Place: Greenwood
Population: 166,315
Median Income: $90,454 (5th best)
Median Home Price: $312,236 (9th best)
Unemployment Rate: 3.0% (23rd best)
More on Johnson County: Data
10. Putnam County

Biggest Place: Greencastle
Population: 37,280
Median Income: $78,378 (15th best)
Median Home Price: $267,413 (23rd best)
Unemployment Rate: 3.1% (26th best)
More on Putnam County: Data
Methodology: How do you determine which Indiana county is the best?
To give you the best county in Indiana, we have to look at a handful of metrics that signal the quality of a place. To do that, we made assumptions about what’s in a “best county” and what isn’t. For reference, we are trying to make the kind of argument you’d make at a bar using facts, Saturday Night Science.
With that in mind, we went to two of the best data sources on the internet. Namely, the American Community Survey data and FBI Crime data for the most recent period.
We paid particular attention to:
- Violent Crime Rates
- Property Crime Rates
- Median Home Values
- Median Income
- Unemployment Rates
- Adult Education Levels
- Health Insurance Coverage
- Poverty Rates
We then ranked each county in Indiana across each of the criteria from one to 92, with one being the best.
Taking the average rank across all criteria, we created a quality of life score with the county posting the lowest overall score being the “Best County To Live In Indiana.”
The result is some of the safest, quietest, and best counties to raise a family in the Hoosier State.
We updated this article for 2026. This report is our eleventh time ranking the best counties to live in Indiana.
Read on to see why Hamilton County is the best county, while Wayne County is probably in contention for being the worst county in Indiana.
Summary: The Best Counties In Indiana To Call Home For 2026
Living in Indiana can vary from one part of the state to the next — who woulda thought?
The best counties in Indiana are Hamilton County, Boone County, Hendricks County, Warrick County, Brown County, Hancock County, Dearborn County, Posey County, Johnson County, and Putnam County.
But now you know the outstanding parts and the parts to avoid, and that’s why you came here to learn at the end of the day.
You are welcome.
Here’s a look at the worst counties in Indiana according to the data:
- Wayne County
- Grant County
- Jay County
For more Indiana reading, check out:
- Best Places To Buy A House In Indiana
- Cheapest Places To Live In Indiana
- Richest Cities In Indiana
- Best Places To Retire In Indiana
Detailed List Of The Best Counties In Indiana
| Rank | County | Population | Median Income | Median Home Price |
|---|---|---|---|---|
| 1 | Hamilton County | 365,056 | $121,530 | $459,567 |
| 2 | Boone County | 74,718 | $111,250 | $415,266 |
| 3 | Hendricks County | 183,344 | $101,144 | $341,028 |
| 4 | Warrick County | 65,261 | $89,844 | $289,812 |
| 5 | Brown County | 15,606 | $78,528 | $361,296 |
| 6 | Hancock County | 84,037 | $93,186 | $326,183 |
| 7 | Dearborn County | 51,094 | $84,735 | $326,619 |
| 8 | Posey County | 25,116 | $78,129 | $236,929 |
| 9 | Johnson County | 166,315 | $90,454 | $312,236 |
| 10 | Putnam County | 37,280 | $78,378 | $267,413 |
| 11 | Ohio County | 5,999 | $70,392 | $281,622 |
| 12 | Porter County | 174,818 | $87,972 | $327,209 |
| 13 | Spencer County | 19,955 | $74,506 | $230,405 |
| 14 | Harrison County | 39,859 | $74,475 | $263,735 |
| 15 | Floyd County | 80,918 | $79,704 | $283,977 |
| 16 | Morgan County | 72,659 | $79,429 | $296,827 |
| 17 | Wells County | 28,420 | $71,957 | $243,340 |
| 18 | Whitley County | 34,618 | $78,083 | $277,786 |
| 19 | Decatur County | 26,422 | $69,783 | $255,695 |
| 20 | Dubois County | 43,614 | $75,979 | $258,761 |
| 21 | Jasper County | 33,234 | $77,314 | $293,763 |
| 22 | Franklin County | 23,020 | $78,074 | $295,555 |
| 23 | Bartholomew County | 83,536 | $79,901 | $272,333 |
| 24 | Ripley County | 29,095 | $70,573 | $277,414 |
| 25 | Warren County | 8,464 | $82,425 | $225,782 |
| 26 | Gibson County | 33,000 | $67,573 | $206,607 |
| 27 | Steuben County | 34,726 | $74,911 | $313,148 |
| 28 | Tipton County | 15,346 | $76,156 | $244,202 |
| 29 | Clark County | 124,354 | $74,214 | $264,157 |
| 30 | Dekalb County | 43,807 | $74,331 | $226,054 |
| 31 | Kosciusko County | 80,442 | $75,317 | $280,134 |
| 32 | Huntington County | 36,798 | $66,301 | $204,640 |
| 33 | Shelby County | 45,265 | $72,190 | $240,678 |
| 34 | Pike County | 12,154 | $71,334 | $179,154 |
| 35 | Wabash County | 30,844 | $66,806 | $187,692 |
| 36 | Monroe County | 140,965 | $65,868 | $311,492 |
| 37 | Lagrange County | 40,805 | $84,487 | $298,028 |
| 38 | Tippecanoe County | 189,071 | $60,636 | $294,950 |
| 39 | Clay County | 26,409 | $70,010 | $180,105 |
| 40 | Noble County | 47,495 | $71,723 | $246,704 |
| 41 | Marshall County | 46,284 | $71,808 | $253,794 |
| 42 | Laporte County | 111,917 | $71,055 | $227,684 |
| 43 | Carroll County | 20,535 | $65,645 | $231,127 |
| 44 | Union County | 6,985 | $76,424 | $189,921 |
| 45 | White County | 24,717 | $67,303 | $224,716 |
| 46 | Montgomery County | 38,312 | $71,479 | $217,143 |
| 47 | Jackson County | 46,660 | $70,262 | $227,842 |
| 48 | Lawrence County | 45,102 | $66,468 | $209,585 |
| 49 | Clinton County | 32,944 | $65,019 | $221,073 |
| 50 | Owen County | 21,604 | $62,464 | $233,983 |
| 51 | Adams County | 36,227 | $65,289 | $245,205 |
| 52 | Newton County | 13,922 | $75,481 | $223,814 |
| 53 | Daviess County | 33,658 | $68,503 | $232,493 |
| 54 | Allen County | 392,378 | $70,737 | $251,390 |
| 55 | Jefferson County | 32,998 | $64,577 | $235,967 |
| 56 | Howard County | 83,752 | $64,027 | $189,568 |
| 57 | Rush County | 16,739 | $66,473 | $213,989 |
| 58 | Lake County | 500,379 | $71,493 | $246,597 |
| 59 | Pulaski County | 12,441 | $62,792 | $180,853 |
| 60 | Martin County | 9,830 | $68,594 | $198,730 |
| 61 | Henry County | 48,970 | $63,150 | $186,352 |
| 62 | Perry County | 19,270 | $61,151 | $185,083 |
| 63 | Knox County | 36,007 | $61,237 | $153,860 |
| 64 | Vermillion County | 15,421 | $60,200 | $133,306 |
| 65 | Elkhart County | 207,132 | $68,561 | $259,371 |
| 66 | Fountain County | 16,617 | $62,542 | $191,646 |
| 67 | Scott County | 24,526 | $56,352 | $201,467 |
| 68 | St. Joseph County | 273,040 | $66,868 | $224,540 |
| 69 | Vanderburgh County | 180,117 | $61,648 | $197,580 |
| 70 | Jennings County | 27,562 | $69,322 | $223,959 |
| 71 | Starke County | 23,365 | $63,960 | $218,801 |
| 72 | Orange County | 19,767 | $65,873 | $182,645 |
| 73 | Washington County | 28,212 | $64,641 | $216,903 |
| 74 | Benton County | 8,735 | $65,875 | $200,724 |
| 75 | Switzerland County | 9,909 | $65,343 | $251,639 |
| 76 | Madison County | 131,900 | $63,037 | $187,049 |
| 77 | Randolph County | 24,387 | $60,791 | $155,838 |
| 78 | Marion County | 975,809 | $66,346 | $229,559 |
| 79 | Greene County | 31,021 | $62,094 | $195,561 |
| 80 | Fayette County | 23,334 | $59,321 | $159,847 |
| 81 | Blackford County | 11,950 | $51,326 | $138,590 |
| 82 | Cass County | 37,680 | $56,403 | $166,719 |
| 83 | Parke County | 16,406 | $68,485 | $213,246 |
| 84 | Sullivan County | 20,780 | $56,204 | $155,897 |
| 85 | Delaware County | 112,280 | $58,127 | $165,536 |
| 86 | Miami County | 35,712 | $61,139 | $157,474 |
| 87 | Crawford County | 10,499 | $49,640 | $170,859 |
| 88 | Fulton County | 20,312 | $61,360 | $200,652 |
| 89 | Vigo County | 106,109 | $52,976 | $156,954 |
| 90 | Jay County | 20,229 | $54,969 | $155,260 |
| 91 | Grant County | 66,295 | $53,522 | $150,334 |
| 92 | Wayne County | 66,397 | $55,692 | $170,215 |