Greencastle SnackAbility
Overall SnackAbility
Cost of living in Greencastle summary. We use data on the cost of living to determine how expensive it is to live in Greencastle. Real estate prices drive most of the variance in cost of living around Indiana. Key points include:
The cost of living in Greencastle is 90 with 100 being average.
The cost of living in Greencastle is 0.9x lower than the national average.
The median home value in Greencastle is $243,386.
The median income in Greencastle is $55,565.
Greencastle's Overall Cost Of Living
Lower Than The National Average
Cost Of Living In Greencastle Comparison Table
| Living Expense | Greencastle | Indiana | National Average |
|---|---|---|---|
| Overall | 90 | 90 | 100 |
| Services | 98 | 97 | 100 |
| Groceries | 97 | 95 | 100 |
| Health | 70 | 72 | 100 |
| Housing | 98 | 98 | 100 |
| Transportation | 95 | 94 | 100 |
| Utilities | 90 | 96 | 100 |
Source: Cost of living index, normalized to US average = 100
Greencastle, IN Weather
The average high in Greencastle is 62.0° and the average low is 42.1°.
There are 80.4 days of precipitation each year.
Expect an average of 43.4 inches of precipitation each year with 19.8 inches of snow.
| Stat | Greencastle |
|---|---|
| Average Annual High | 62.0 |
| Average Annual Low | 42.1 |
| Annual Precipitation Days | 80.4 |
| Average Annual Precipitation | 43.4 |
| Average Annual Snowfall | 19.8 |
Average High
Days of Rain
Source: NOAA climate normals (30-year)
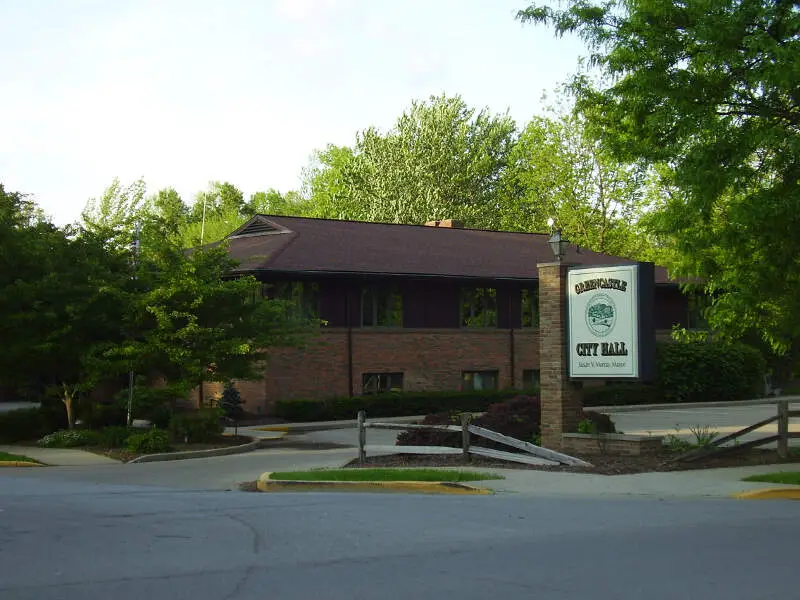
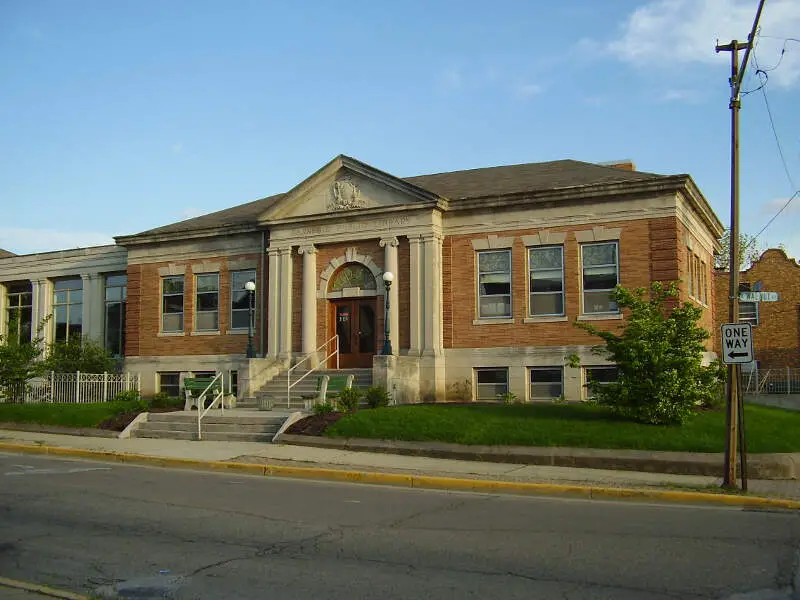
Greencastle, IN Photos
Rankings & Articles For Greencastle


Locations Around Greencastle
Map Of Greencastle, IN
Best Places Around Greencastle
Paris, IL
Population 8,276
Zionsville, IN
Population 32,095
Carmel, IN
Population 101,651
Brownsburg, IN
Population 31,215
Westfield, IN
Population 54,677
New Whiteland, IN
Population 5,704
Lawrence, IN
Population 49,517
Danville, IN
Population 11,714
Cumberland, IN
Population 6,267
Bloomington, IN
Population 80,049
Greencastle Demographics And Statistics
Population over time in Greencastle
The current population in Greencastle is 9,864. The population has decreased 4.8% from 2010.
| Year | Population | % Change |
|---|---|---|
| 2024 | 9,864 | 0.0% |
| 2023 | 9,863 | -0.0% |
| 2022 | 9,865 | -1.2% |
| 2021 | 9,980 | -3.2% |
| 2020 | 10,312 | 0.2% |
| 2019 | 10,296 | -1.6% |
| 2018 | 10,461 | 0.3% |
| 2017 | 10,426 | 0.1% |
| 2016 | 10,413 | 1.0% |
| 2015 | 10,314 | 0.1% |
| 2014 | 10,307 | -0.0% |
| 2013 | 10,309 | -0.3% |
| 2012 | 10,343 | -0.2% |
| 2011 | 10,364 | 0.1% |
| 2010 | 10,357 | - |
Race / Ethnicity in Greencastle
See the full breakdown
Greencastle is:
83.9% White with 8,273 White residents.
5.1% African American with 504 African American residents.
0.2% American Indian with 22 American Indian residents.
2.6% Asian with 259 Asian residents.
0.0% Hawaiian with 0 Hawaiian residents.
0.5% Other with 46 Other residents.
4.2% Two Or More with 410 Two Or More residents.
3.5% Hispanic with 350 Hispanic residents.
| Race | Greencastle | IN | USA |
|---|---|---|---|
| White | 83.9% | 75.4% | 57.4% |
| African American | 5.1% | 9.1% | 11.9% |
| American Indian | 0.2% | 0.1% | 0.5% |
| Asian | 2.6% | 2.6% | 5.9% |
| Hawaiian | 0.0% | 0.0% | 0.2% |
| Other | 0.5% | 0.4% | 0.6% |
| Two Or More | 4.2% | 3.8% | 4.3% |
| Hispanic | 3.5% | 8.6% | 19.3% |
Gender in Greencastle
See the full breakdown
Greencastle is 47.3% female with 4,666 female residents.
Greencastle is 52.7% male with 5,198 male residents.
| Gender | Greencastle | IN | USA |
|---|---|---|---|
| Female | 47.3% | 50.4% | 50.5% |
| Male | 52.7% | 49.6% | 49.5% |
Highest level of educational attainment in Greencastle for adults over 25
See the full breakdown
1.0% of adults in Greencastle completed < 9th grade.
7.0% of adults in Greencastle completed 9-12th grade.
39.0% of adults in Greencastle completed high school / ged.
21.0% of adults in Greencastle completed some college.
9.0% of adults in Greencastle completed associate's degree.
12.0% of adults in Greencastle completed bachelor's degree.
7.0% of adults in Greencastle completed master's degree.
1.0% of adults in Greencastle completed professional degree.
3.0% of adults in Greencastle completed doctorate degree.
| Education | Greencastle | IN | USA |
|---|---|---|---|
| < 9th Grade | 1.0% | 3.0% | 4.0% |
| 9-12th Grade | 7.0% | 6.0% | 6.0% |
| High School / GED | 39.0% | 33.0% | 26.0% |
| Some College | 21.0% | 19.0% | 19.0% |
| Associate's Degree | 9.0% | 9.0% | 9.0% |
| Bachelor's Degree | 12.0% | 19.0% | 22.0% |
| Master's Degree | 7.0% | 8.0% | 10.0% |
| Professional Degree | 1.0% | 2.0% | 2.0% |
| Doctorate Degree | 3.0% | 1.0% | 2.0% |
Household Income For Greencastle, Indiana
See the full breakdown
3.1% of households in Greencastle earn Less than $10,000.
4.1% of households in Greencastle earn $10,000 to $14,999.
14.0% of households in Greencastle earn $15,000 to $24,999.
13.5% of households in Greencastle earn $25,000 to $34,999.
12.5% of households in Greencastle earn $35,000 to $49,999.
16.6% of households in Greencastle earn $50,000 to $74,999.
12.6% of households in Greencastle earn $75,000 to $99,999.
14.4% of households in Greencastle earn $100,000 to $149,999.
6.2% of households in Greencastle earn $150,000 to $199,999.
2.9% of households in Greencastle earn $200,000 or more.
| Income | Greencastle | IN | USA |
|---|---|---|---|
| Less than $10,000 | 3.1% | 4.9% | 5.0% |
| $10,000 to $14,999 | 4.1% | 3.4% | 3.4% |
| $15,000 to $24,999 | 14.0% | 6.8% | 6.3% |
| $25,000 to $34,999 | 13.5% | 7.5% | 6.6% |
| $35,000 to $49,999 | 12.5% | 11.8% | 10.1% |
| $50,000 to $74,999 | 16.6% | 17.7% | 15.5% |
| $75,000 to $99,999 | 12.6% | 13.9% | 12.6% |
| $100,000 to $149,999 | 14.4% | 17.5% | 17.5% |
| $150,000 to $199,999 | 6.2% | 8.3% | 9.6% |
| $200,000 or more | 2.9% | 8.2% | 13.4% |
Source: U.S. Census ACS 5-year estimates (2024)


