
Some of you might be asking yourself, at this very moment, is Kentucky a good place?
The answer is unequivocally yes… if you know where to locate the best counties to live in Kentucky.
Lucky for you, we’re here to help you identify the best counties to live in the Bluegrass State based on the most recently available data from the Census. And this isn’t our first rodeo — we’ve been using Saturday Night Science to rank places for years.
The question becomes if you wanted to relocate to the best part of Kentucky, where would you go? To answer that, we looked at crime, cost of living, and demographic data for all 120 counties in the state.
Table Of Contents: Top Ten | Methodology | Table | FAQs | Summary
The 10 Best Counties To Live In Kentucky For 2026
Oldham County is the county to be when it comes to living the good life in Kentucky. And you should avoid Knox County if you can — at least according to the data.
Now you know exactly where to move in Kentucky. Keep on reading for more about the top ten and a detailed methodology.
Or, check out the best places to live in Kentucky and the cheapest places to live in Kentucky.
Table Of Contents: Top Ten | Methodology | Summary | Table
The Best Counties To Live In Kentucky For 2026
1. Oldham County
Biggest Place: La Grange
Population: 69,257
Median Income: $122,497 (best)
Median Home Price: $441,311 (best)
Unemployment Rate: 3.5% (2best)
More on Oldham County: Data
2. Boone County
Biggest Place: Florence
Population: 139,841
Median Income: $99,414 (3rd best)
Median Home Price: $342,671 (4th best)
Unemployment Rate: 3.1% (12th best)
More on Boone County: Data
3. Bullitt County
Biggest Place: Mount Washington
Population: 84,027
Median Income: $80,558 (7th best)
Median Home Price: $295,710 (9th best)
Unemployment Rate: 4.3% (43rd best)
More on Bullitt County: Data
4. Spencer County
Biggest Place: Elk Creek
Population: 20,193
Median Income: $102,618 (2nd best)
Median Home Price: $369,356 (2nd best)
Unemployment Rate: 5.0% (67th best)
More on Spencer County: Data
5. Anderson County
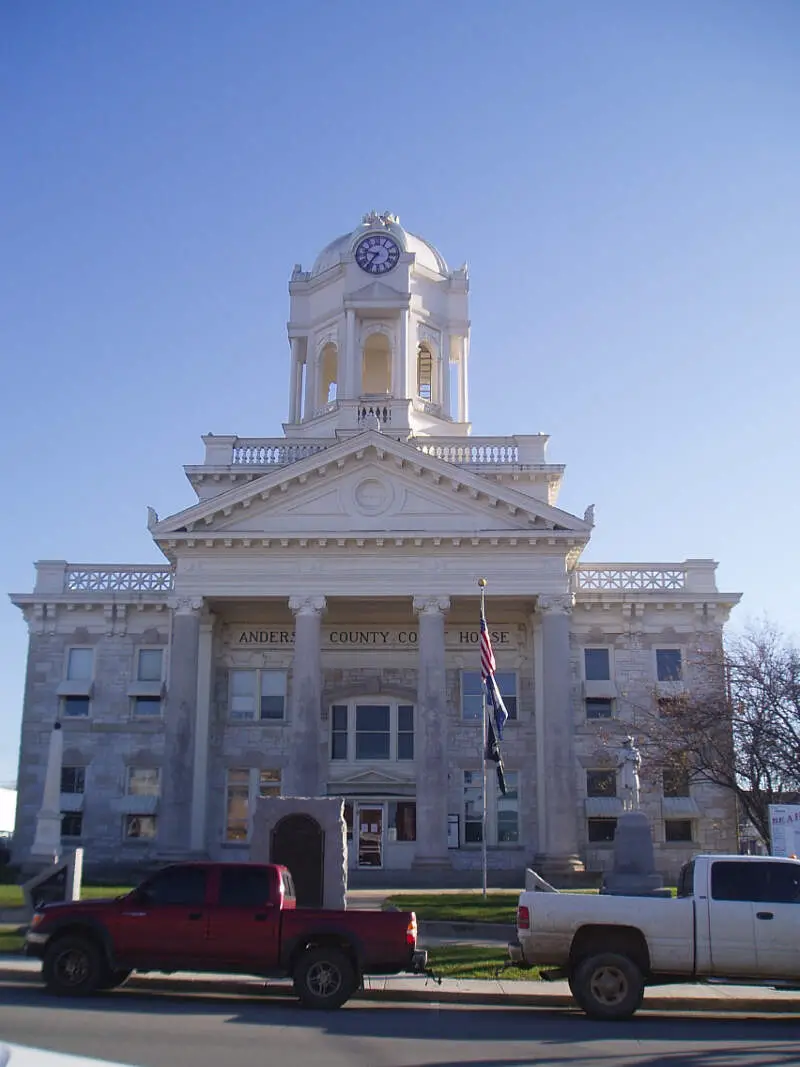
Biggest Place: Lawrenceburg
Population: 24,353
Median Income: $74,488 (11th best)
Median Home Price: $256,239 (20th best)
Unemployment Rate: 2.2% (3rd best)
More on Anderson County: Data
6. Scott County
Biggest Place: Georgetown
Population: 59,536
Median Income: $85,158 (4th best)
Median Home Price: $338,690 (5th best)
Unemployment Rate: 4.3% (44th best)
More on Scott County: Data
7. Woodford County

Biggest Place: Versailles
Population: 27,279
Median Income: $83,788 (5th best)
Median Home Price: $343,458 (3rd best)
Unemployment Rate: 2.5% (5th best)
More on Woodford County: Data
8. Campbell County
Biggest Place: Fort Thomas
Population: 93,426
Median Income: $77,567 (9th best)
Median Home Price: $291,569 (12th best)
Unemployment Rate: 4.0% (29th best)
More on Campbell County: Data
9. Kenton County

Biggest Place: Covington
Population: 171,288
Median Income: $80,548 (8th best)
Median Home Price: $282,910 (14th best)
Unemployment Rate: 4.3% (45th best)
More on Kenton County: Data
10. Nelson County
Biggest Place: Bardstown
Population: 47,606
Median Income: $69,562 (14th best)
Median Home Price: $266,250 (17th best)
Unemployment Rate: 3.3% (16th best)
More on Nelson County: Data
Methodology: How do you determine which Kentucky county is the best?
To give you the best county in Kentucky, we have to look at a handful of metrics that signal the quality of a place. To do that, we made assumptions about what’s in a “best county” and what isn’t. For reference, we are trying to make the kind of argument you’d make at a bar using facts, Saturday Night Science.
With that in mind, we went to two of the best data sources on the internet. Namely, the American Community Survey data and FBI Crime data for the most recent period.
We paid particular attention to:
- Violent Crime Rates
- Property Crime Rates
- Median Home Values
- Median Income
- Unemployment Rates
- Adult Education Levels
- Health Insurance Coverage
- Poverty Rates
We then ranked each county in Kentucky across each of the criteria from one to 120, with one being the best.
Taking the average rank across all criteria, we created a quality of life score with the county posting the lowest overall score being the “Best County To Live In Kentucky.”
The result is some of the safest, quietest, and best counties to raise a family in the Bluegrass State.
We updated this article for 2026. This report is our eleventh time ranking the best counties to live in Kentucky.
Read on to see why Oldham County is the best county, while Knox County is probably in contention for being the worst county in Kentucky.
Summary: The Best Counties In Kentucky To Call Home For 2026
Living in Kentucky can vary from one part of the state to the next — who woulda thought?
The best counties in Kentucky are Oldham County, Boone County, Bullitt County, Spencer County, Anderson County, Scott County, Woodford County, Campbell County, Kenton County, and Nelson County.
But now you know the outstanding parts and the parts to avoid, and that’s why you came here to learn at the end of the day.
You are welcome.
Here’s a look at the worst counties in Kentucky according to the data:
- Knox County
- Bell County
- Casey County
For more Kentucky reading, check out:
- Best Places To Retire In Kentucky
- Best Places To Buy A House In Kentucky
- Richest Cities In Kentucky
- Safest Places In Kentucky
Detailed List Of The Best Counties In Kentucky
| Rank | County | Population | Median Income | Median Home Price |
|---|---|---|---|---|
| 1 | Oldham County | 69,257 | $122,497 | $441,311 |
| 2 | Boone County | 139,841 | $99,414 | $342,671 |
| 3 | Bullitt County | 84,027 | $80,558 | $295,710 |
| 4 | Spencer County | 20,193 | $102,618 | $369,356 |
| 5 | Anderson County | 24,353 | $74,488 | $256,239 |
| 6 | Scott County | 59,536 | $85,158 | $338,690 |
| 7 | Woodford County | 27,279 | $83,788 | $343,458 |
| 8 | Campbell County | 93,426 | $77,567 | $291,569 |
| 9 | Kenton County | 171,288 | $80,548 | $282,910 |
| 10 | Nelson County | 47,606 | $69,562 | $266,250 |
| 11 | Harrison County | 19,140 | $66,442 | $235,480 |
| 12 | Shelby County | 49,096 | $82,604 | $323,518 |
| 13 | Jessamine County | 54,588 | $74,576 | $320,970 |
| 14 | Mercer County | 23,028 | $64,824 | $238,830 |
| 15 | Meade County | 30,158 | $74,355 | $282,334 |
| 16 | Bourbon County | 20,240 | $61,354 | $248,557 |
| 17 | Larue County | 15,107 | $67,067 | $221,880 |
| 18 | Ballard County | 7,654 | $66,164 | $130,038 |
| 19 | Henderson County | 44,280 | $58,851 | $200,774 |
| 20 | Clark County | 37,192 | $64,348 | $259,293 |
| 21 | Grant County | 25,418 | $69,178 | $283,036 |
| 22 | Mccracken County | 67,564 | $64,373 | $193,181 |
| 23 | Jefferson County | 783,022 | $69,866 | $264,190 |
| 24 | Mclean County | 9,114 | $65,596 | $153,568 |
| 25 | Fayette County | 323,725 | $69,479 | $328,842 |
| 26 | Daviess County | 103,648 | $68,214 | $215,146 |
| 27 | Lyon County | 8,900 | $65,066 | $177,158 |
| 28 | Hancock County | 9,034 | $65,464 | $203,526 |
| 29 | Franklin County | 51,842 | $65,298 | $239,679 |
| 30 | Hardin County | 111,942 | $67,647 | $245,406 |
| 31 | Madison County | 95,769 | $63,351 | $281,530 |
| 32 | Marion County | 19,749 | $59,627 | $235,196 |
| 33 | Washington County | 12,140 | $61,616 | $250,388 |
| 34 | Bracken County | 8,444 | $66,319 | $202,626 |
| 35 | Trimble County | 8,550 | $66,027 | $237,023 |
| 36 | Taylor County | 26,397 | $60,456 | $207,412 |
| 37 | Warren County | 140,918 | $65,794 | $294,046 |
| 38 | Simpson County | 19,972 | $59,858 | $253,149 |
| 39 | Carlisle County | 4,762 | $62,439 | $136,907 |
| 40 | Marshall County | 31,743 | $65,831 | $200,096 |
| 41 | Boyle County | 30,941 | $61,159 | $241,154 |
| 42 | Webster County | 12,842 | $59,628 | $144,024 |
| 43 | Henry County | 15,856 | $63,347 | $250,391 |
| 44 | Union County | 13,260 | $60,327 | $133,740 |
| 45 | Garrard County | 17,568 | $63,087 | $291,730 |
| 46 | Livingston County | 8,903 | $58,984 | $144,381 |
| 47 | Montgomery County | 28,395 | $56,396 | $226,506 |
| 48 | Pendleton County | 14,723 | $64,669 | $239,967 |
| 49 | Nicholas County | 7,708 | $59,531 | $199,883 |
| 50 | Boyd County | 47,911 | $61,118 | $130,494 |
| 51 | Gallatin County | 8,769 | $63,346 | $211,483 |
| 52 | Robertson County | 2,283 | $51,830 | $204,773 |
| 53 | Calloway County | 38,224 | $52,706 | $165,373 |
| 54 | Ohio County | 23,735 | $57,798 | $148,738 |
| 55 | Greenup County | 35,501 | $60,751 | $151,274 |
| 56 | Caldwell County | 12,618 | $59,583 | $148,728 |
| 57 | Allen County | 21,293 | $61,403 | $209,421 |
| 58 | Mason County | 16,956 | $52,178 | $166,855 |
| 59 | Graves County | 36,630 | $50,772 | $167,100 |
| 60 | Rowan County | 24,578 | $54,321 | $179,763 |
| 61 | Laurel County | 62,983 | $57,771 | $180,308 |
| 62 | Todd County | 12,469 | $61,103 | $221,369 |
| 63 | Logan County | 27,986 | $60,382 | $194,783 |
| 64 | Barren County | 44,938 | $50,628 | $212,440 |
| 65 | Hopkins County | 45,119 | $56,815 | $149,498 |
| 66 | Owen County | 11,330 | $61,134 | $174,605 |
| 67 | Pulaski County | 65,897 | $51,898 | $172,252 |
| 68 | Christian County | 72,069 | $55,494 | $205,858 |
| 69 | Hickman County | 4,439 | $60,867 | $122,762 |
| 70 | Monroe County | 11,269 | $51,280 | $144,850 |
| 71 | Muhlenberg County | 30,591 | $51,927 | $127,979 |
| 72 | Breckinridge County | 20,881 | $55,843 | $166,094 |
| 73 | Trigg County | 14,315 | $59,857 | $143,558 |
| 74 | Bath County | 12,851 | $56,541 | $173,428 |
| 75 | Morgan County | 14,053 | $47,913 | $136,291 |
| 76 | Edmonson County | 12,355 | $54,937 | $191,973 |
| 77 | Hart County | 19,603 | $52,285 | $185,516 |
| 78 | Fulton County | 6,409 | $38,217 | $85,860 |
| 79 | Green County | 11,369 | $46,798 | $188,888 |
| 80 | Metcalfe County | 10,425 | $51,473 | $170,421 |
| 81 | Crittenden County | 8,979 | $46,656 | $126,163 |
| 82 | Carter County | 26,341 | $51,235 | $159,696 |
| 83 | Butler County | 12,393 | $56,092 | $187,635 |
| 84 | Adair County | 19,089 | $53,553 | $170,019 |
| 85 | Lincoln County | 24,504 | $52,440 | $180,736 |
| 86 | Leslie County | 10,079 | $35,934 | $80,556 |
| 87 | Jackson County | 13,086 | $40,000 | $110,808 |
| 88 | Johnson County | 22,334 | $44,904 | $141,663 |
| 89 | Pike County | 56,727 | $44,312 | $100,849 |
| 90 | Wayne County | 19,602 | $45,739 | $167,850 |
| 91 | Fleming County | 15,323 | $49,307 | $178,560 |
| 92 | Clinton County | 9,202 | $44,844 | $157,825 |
| 93 | Lawrence County | 16,077 | $46,772 | $152,920 |
| 94 | Carroll County | 10,954 | $56,466 | $190,250 |
| 95 | Rockcastle County | 16,163 | $48,862 | $147,046 |
| 96 | Grayson County | 26,707 | $50,757 | $163,925 |
| 97 | Powell County | 13,038 | $40,309 | $152,340 |
| 98 | Perry County | 27,499 | $42,181 | $97,332 |
| 99 | Whitley County | 36,920 | $44,615 | $150,377 |
| 100 | Letcher County | 20,808 | $41,793 | $72,924 |