Did you know that the bigger the hat you wear to the Kentucky Derby in Louisville, the more money people think you have?
All joking aside, we’re here to tell you where the location of the richest places in Kentucky for 2026.
Many of the state’s wealthiest places are also Kentucky’s best. And like the rest of the country, the wealthy in Kentucky spare no expense. That’s why we looked at the median income and home prices for 108 Kentucky places with at least 3,000 residents to narrow down the most well-to-do places.
If you guessed that Bowling Green and Owensboro made the list, guess again. Many of Kentucky’s most affluent places are centered around the state’s eighth largest city, Florence. Are you at all surprised? We aren’t. Florence is super safe, and this key attribute is trickling down to Kentucky’s richest places.
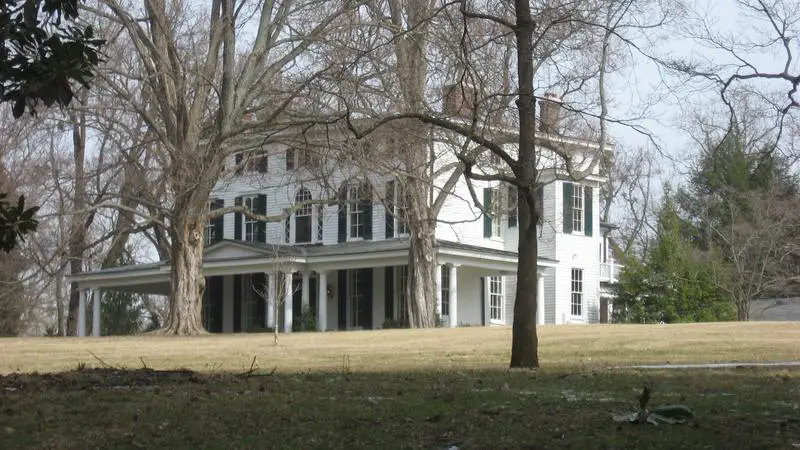
$163,462 median income · 2.4% poverty · #1 income in Kentucky
Data | Crime | Cost of living | Movers
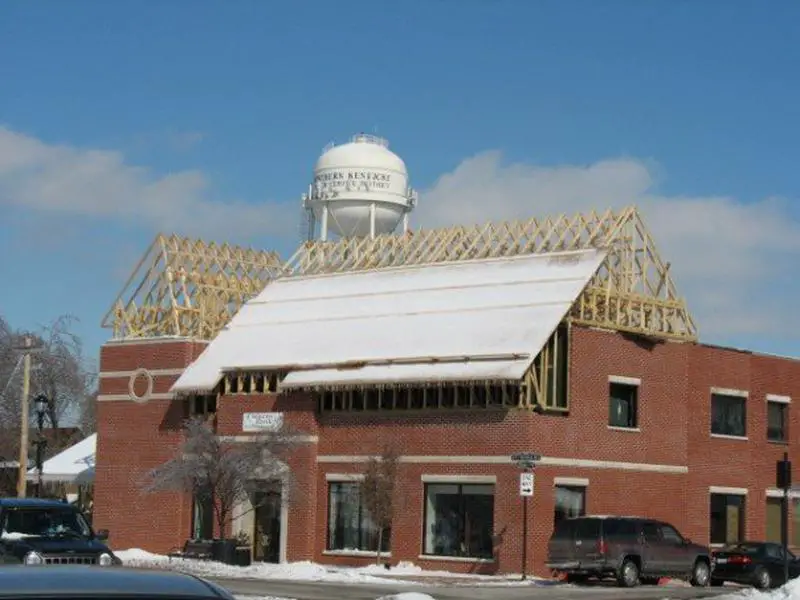
$136,712 median income · 2.9% poverty · #2 income in Kentucky
Union is a home rule-class city in Boone County, Kentucky, United States. The population was 5,379 as of the 2010 United States Census. The area was rural until mass residential growth in the 1990s and 2000s.
Data | Crime | Cost of living | Movers
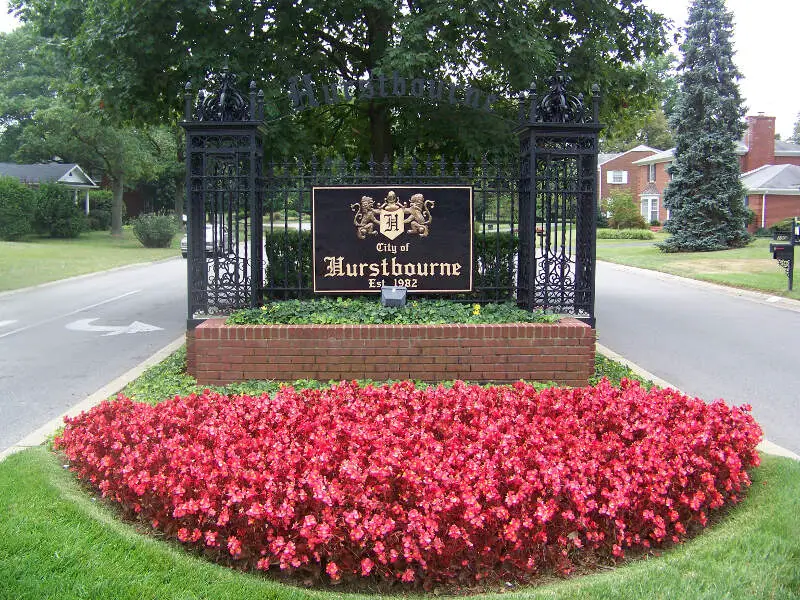
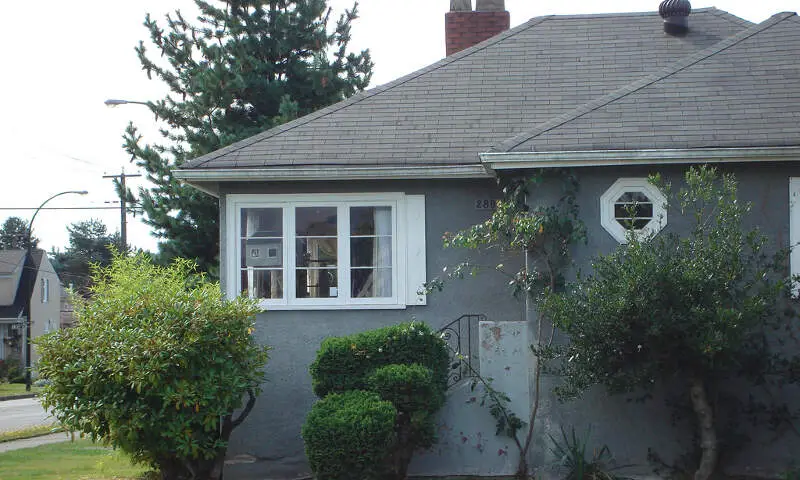
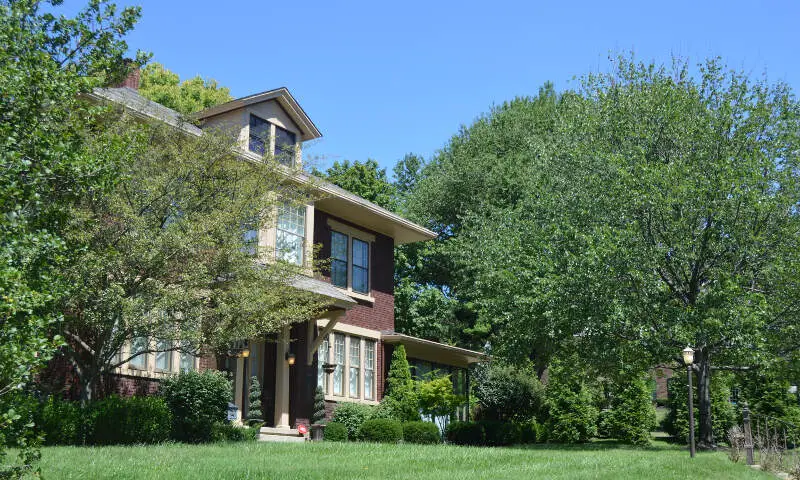
$116,094 median income · 5.5% poverty · #4 income in Kentucky
Data | Crime | Cost of living | Movers
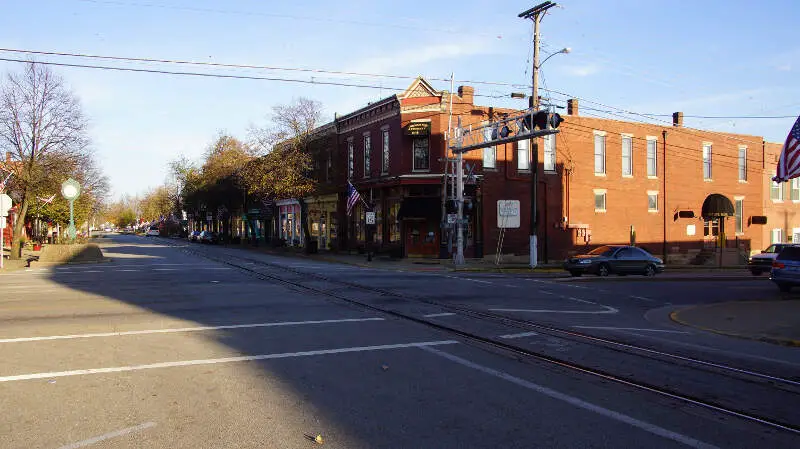
$108,046 median income · 8.1% poverty · #5 income in Kentucky
Data | Crime | Cost of living | Movers
$107,859 median income · 3.7% poverty · #6 income in Kentucky
Data | Crime | Cost of living | Movers
$119,028 median income · 3.8% poverty · #3 income in Kentucky
Data | Crime | Cost of living | Movers
$91,188 median income · 6.8% poverty · #15 income in Kentucky
$104,350 median income · 6.1% poverty · #8 income in Kentucky
Fort Thomas is a home rule-class city in Campbell County, Kentucky, United States, on the southern bank of the Ohio River and the site of an 1890 US Army post. The population was 16,325 at the 2010 census, making it the largest city in Campbell County and it is officially part of the Cincinnati – Northern Kentucky metropolitan area.
Data | Crime | Cost of living | Movers
$86,310 median income · 8.1% poverty · #18 income in Kentucky
Fort Mitchell is a home rule-class city in Kenton County, Kentucky, in the United States. The population was 8,207 at the 2010 census.
Data | Crime | Cost of living | Movers
$88,464 median income · 8.0% poverty · #17 income in Kentucky
La Grange is a home rule-class city in Oldham County, Kentucky, in the United States. The population was 8,082 at the time of the 2010 U.S. census. It is the seat of its county.
Data | Crime | Cost of living | Movers
The receipts
Compare the top ten
Pick a metric. The bars rescale. The red line is Kentucky’s statewide median.
Kentucky statewide median: $63,726
Kentucky statewide median: $231,894
Kentucky statewide median: 16.1%
Kentucky statewide median: 4.9%
On the map
Where the money lives in Kentucky
Saturday Night Science
How we determined the richest places in Kentucky for 2026
The first thing most people reach for is personal income. After all, rich people have really high salaries. But one statistic doesn’t capture what it means to be one of the “richest places,” so we applied Saturday Night Science to two measures from the 2020-2024 American Community Survey:
- Median household income
- Median home value
Median household income is the most digestible way to understand how rich a place is, and home values are a measure of accumulated wealth. The two combine to define a “Rich City.”
After collecting the data for all 108 places in Kentucky with more than 3,000 people, we ranked each place from 1 to 108 on both criteria, then averaged the two ranks into a “Rich Score.” The place with the lowest Rich Score, Prospect, is crowned the richest city in Kentucky for 2026.
The full plate
All 100 richest cities in Kentucky, ranked
Click any column to sort. Search by city name.
| Rank | City | Rich Score | Population | Median income | Median home value | Poverty | Unemployment |
|---|---|---|---|---|---|---|---|
| 1 | Prospect | 1.00 | 4,542 | $163,462 | $620,089 | 2.4% | 4.2% |
| 2 | Union | 3.00 | 7,642 | $136,712 | $449,093 | 2.9% | 1.5% |
| 3 | Hurstbourne | 3.00 | 4,702 | $116,094 | $611,994 | 5.5% | 3.6% |
| 4 | Crestwood | 4.00 | 6,356 | $108,046 | $481,032 | 8.1% | 2.7% |
| 5 | Villa Hills | 6.50 | 7,480 | $107,859 | $393,017 | 3.7% | 3.6% |
| 6 | Edgewood | 8.00 | 8,447 | $119,028 | $361,115 | 3.8% | 2.4% |
| 7 | Simpsonville | 10.00 | 3,062 | $91,188 | $416,963 | 6.8% | 1.8% |
| 8 | Fort Thomas | 10.00 | 17,169 | $104,350 | $368,293 | 6.1% | 3.5% |
| 9 | Fort Mitchell | 12.00 | 8,713 | $86,310 | $398,735 | 8.1% | 2.4% |
| 10 | La Grange | 12.50 | 10,311 | $88,464 | $392,372 | 8.0% | 4.2% |
| 11 | Fort Wright | 13.00 | 5,887 | $105,024 | $334,172 | 3.0% | 3.4% |
| 12 | Park Hills | 13.50 | 3,165 | $99,861 | $343,282 | 7.5% | 5.2% |
| 13 | Alexandria | 13.50 | 10,562 | $102,239 | $338,680 | 7.7% | 3.2% |
| 14 | Independence | 15.50 | 29,392 | $102,361 | $323,031 | 8.8% | 4.3% |
| 15 | Middletown | 15.50 | 9,763 | $82,537 | $378,971 | 9.1% | 4.7% |
| 16 | St. Matthews | 15.50 | 17,577 | $82,412 | $381,227 | 7.2% | 3.8% |
| 17 | Douglass Hills | 16.50 | 5,474 | $78,482 | $390,589 | 6.4% | 8.3% |
| 18 | Mount Washington | 16.50 | 18,480 | $96,239 | $325,406 | 5.3% | 4.6% |
| 19 | Crestview Hills | 18.50 | 3,284 | $95,441 | $318,527 | 11.7% | 6.0% |
| 20 | Walton | 19.50 | 5,730 | $77,917 | $349,337 | 13.0% | 3.2% |
| 21 | Georgetown | 20.50 | 39,117 | $80,088 | $336,540 | 12.1% | 4.2% |
| 22 | Crescent Springs | 23.00 | 4,486 | $83,066 | $310,074 | 5.4% | 7.6% |
| 23 | Wilmore | 26.00 | 6,057 | $77,665 | $311,534 | 12.5% | 2.5% |
| 24 | Williamstown | 26.50 | 3,945 | $95,050 | $269,061 | 7.7% | 2.9% |
| 25 | Taylor Mill | 26.50 | 6,937 | $88,546 | $276,590 | 10.9% | 2.1% |
| 26 | Lexington-Fayette urban county | 28.00 | 323,725 | $69,479 | $331,036 | 14.9% | 4.9% |
| 27 | Shelbyville | 28.50 | 17,668 | $75,610 | $305,922 | 14.5% | 3.5% |
| 28 | Jeffersontown | 28.50 | 29,199 | $81,506 | $282,762 | 6.5% | 2.8% |
| 29 | Cold Spring | 29.50 | 6,341 | $75,000 | $302,336 | 9.9% | 2.0% |
| 30 | Nicholasville | 30.00 | 32,197 | $68,503 | $320,269 | 13.1% | 3.6% |
| 31 | Versailles | 30.50 | 10,492 | $62,368 | $348,651 | 16.4% | 3.0% |
| 32 | Shepherdsville | 33.00 | 14,533 | $71,476 | $285,270 | 21.5% | 4.2% |
| 33 | Florence | 33.50 | 32,803 | $71,003 | $286,328 | 9.5% | 3.1% |
| 34 | Lyndon | 34.50 | 11,030 | $65,679 | $312,200 | 9.2% | 4.6% |
| 35 | Vine Grove | 34.50 | 6,830 | $72,560 | $269,116 | 11.1% | 3.5% |
| 36 | Erlanger | 38.50 | 19,875 | $75,840 | $245,646 | 13.7% | 4.3% |
| 37 | Louisville/Jefferson County metro government (balance) | 40.00 | 631,818 | $66,849 | $263,814 | 15.8% | 5.5% |
| 38 | Bellevue | 41.50 | 5,636 | $71,166 | $245,119 | 11.4% | 2.2% |
| 39 | Lawrenceburg | 42.00 | 11,943 | $66,486 | $261,326 | 12.0% | 1.8% |
| 40 | Crittenden | 44.00 | 4,084 | $57,283 | $286,493 | 9.5% | 5.2% |
| 41 | Elizabethtown | 44.50 | 32,576 | $60,760 | $268,313 | 17.0% | 5.2% |
| 42 | Russell | 45.50 | 3,676 | $76,182 | $213,118 | 4.7% | 3.9% |
| 43 | Hillview | 47.00 | 8,797 | $68,111 | $224,675 | 11.2% | 3.8% |
| 44 | Berea | 49.00 | 15,786 | $59,495 | $247,721 | 17.9% | 4.2% |
| 45 | Newport | 49.50 | 13,967 | $60,853 | $242,641 | 20.8% | 7.2% |
| 46 | Wilder | 50.00 | 3,135 | $70,893 | $211,532 | 18.6% | 3.5% |
| 47 | Franklin | 50.00 | 10,360 | $59,052 | $247,589 | 17.1% | 6.2% |
| 48 | Paris | 51.50 | 10,160 | $55,839 | $256,361 | 16.9% | 3.6% |
| 49 | Richmond | 51.50 | 37,111 | $50,870 | $297,033 | 19.5% | 6.7% |
| 50 | Winchester | 53.00 | 19,213 | $54,378 | $256,849 | 17.3% | 3.6% |
| 51 | Covington | 53.50 | 41,110 | $61,166 | $221,429 | 20.8% | 5.7% |
| 52 | Ludlow | 54.00 | 4,378 | $65,284 | $213,778 | 24.4% | 4.2% |
| 53 | Elsmere | 54.50 | 9,205 | $60,503 | $222,955 | 15.6% | 5.1% |
| 54 | Bowling Green | 55.50 | 75,388 | $48,873 | $288,241 | 25.6% | 4.9% |
| 55 | Bardstown | 55.50 | 13,804 | $51,381 | $262,584 | 14.7% | 4.0% |
| 56 | Hodgenville | 56.00 | 3,389 | $57,739 | $224,284 | 19.1% | 0.0% |
| 57 | Cynthiana | 57.00 | 6,458 | $54,647 | $236,040 | 30.5% | 1.3% |
| 58 | Dayton | 57.00 | 5,743 | $65,992 | $200,111 | 15.9% | 5.0% |
| 59 | Danville | 58.00 | 17,327 | $52,646 | $247,085 | 17.4% | 6.6% |
| 60 | Frankfort | 59.00 | 28,503 | $53,073 | $240,679 | 19.1% | 7.8% |
| 61 | Southgate | 59.50 | 3,717 | $54,421 | $223,419 | 19.8% | 3.2% |
| 62 | Mount Sterling | 60.00 | 7,551 | $55,827 | $218,631 | 16.9% | 3.7% |
| 63 | Benton | 60.50 | 4,748 | $66,827 | $180,112 | 11.4% | 4.0% |
| 64 | Radcliff | 60.50 | 22,864 | $58,559 | $209,910 | 15.9% | 9.3% |
| 65 | Owensboro | 62.50 | 60,302 | $56,357 | $209,852 | 18.9% | 5.3% |
| 66 | Lancaster | 65.00 | 4,013 | $43,898 | $282,114 | 29.1% | 11.7% |
| 67 | Harrodsburg | 67.00 | 9,313 | $48,381 | $237,089 | 14.5% | 6.1% |
| 68 | Morganfield | 68.00 | 3,185 | $65,829 | $158,448 | 15.9% | 0.4% |
| 69 | Highland Heights | 68.00 | 6,444 | $53,275 | $205,650 | 19.9% | 3.0% |
| 70 | Oak Grove | 71.50 | 7,962 | $49,354 | $210,939 | 23.1% | 9.5% |
| 71 | Campbellsville | 72.50 | 11,622 | $49,644 | $209,817 | 23.4% | 7.4% |
| 72 | Lebanon | 72.50 | 6,430 | $45,479 | $227,854 | 25.6% | 3.7% |
| 73 | Flatwoods | 75.00 | 7,269 | $59,972 | $142,236 | 18.4% | 6.4% |
| 74 | Paducah | 76.50 | 26,845 | $49,915 | $191,091 | 22.3% | 4.0% |
| 75 | Corbin | 76.50 | 8,246 | $51,065 | $176,478 | 26.0% | 7.2% |
| 76 | Hopkinsville | 77.00 | 30,906 | $49,139 | $195,680 | 19.3% | 6.2% |
| 77 | Madisonville | 77.00 | 19,515 | $53,860 | $159,338 | 23.3% | 6.9% |
| 78 | Stanford | 77.00 | 3,643 | $49,337 | $192,027 | 12.0% | 1.1% |
| 79 | Henderson | 78.00 | 27,852 | $48,186 | $198,772 | 18.7% | 2.4% |
| 80 | Glasgow | 78.50 | 15,197 | $43,074 | $214,446 | 21.9% | 4.3% |
| 81 | Shively | 79.00 | 15,638 | $50,221 | $174,485 | 14.7% | 6.9% |
| 82 | Beaver Dam | 79.50 | 3,524 | $53,944 | $149,179 | 11.2% | 12.5% |
| 83 | London | 82.00 | 7,561 | $47,591 | $182,770 | 30.2% | 3.5% |
| 84 | Murray | 83.50 | 18,080 | $44,091 | $198,098 | 24.1% | 5.8% |
| 85 | Russellville | 84.00 | 7,316 | $45,484 | $187,675 | 20.7% | 6.4% |
| 86 | Scottsville | 85.50 | 4,427 | $35,562 | $207,712 | 21.9% | 8.7% |
| 87 | Columbia | 86.00 | 4,808 | $47,299 | $168,645 | 18.3% | 4.4% |
| 88 | Ashland | 86.00 | 21,295 | $52,715 | $121,324 | 22.4% | 7.7% |
| 89 | Carrollton | 88.50 | 3,915 | $45,871 | $161,108 | 22.8% | 6.5% |
| 90 | Central City | 89.00 | 5,707 | $50,885 | $120,968 | 25.6% | 9.4% |
| 91 | Somerset | 89.50 | 12,216 | $34,704 | $191,314 | 27.2% | 8.7% |
| 92 | Hazard | 89.50 | 5,008 | $51,016 | $102,374 | 31.5% | 7.1% |
| 93 | Leitchfield | 90.00 | 6,819 | $44,347 | $166,231 | 24.3% | 10.2% |
| 94 | Monticello | 91.00 | 5,753 | $44,952 | $158,807 | 30.4% | 2.0% |
| 95 | Morehead | 91.00 | 6,870 | $36,741 | $179,844 | 38.0% | 5.4% |
| 96 | West Liberty | 91.50 | 3,295 | $48,235 | $136,781 | 17.4% | 6.3% |
| 97 | Princeton | 91.50 | 6,241 | $47,411 | $146,193 | 15.8% | 4.5% |
| 98 | Greenville | 92.00 | 4,410 | $46,054 | $146,899 | 21.3% | 5.3% |
| 99 | Mayfield | 94.00 | 9,868 | $40,965 | $158,700 | 26.9% | 3.4% |
| 100 | Grayson | 95.00 | 3,778 | $27,542 | $174,076 | 37.9% | 7.6% |
Source: U.S. Census ACS 2020-2024, Zillow research. 108 cities with more than 3,000 residents.
Prospect is the richest place in Kentucky for 2026
When we set out to identify the richest places in Kentucky, we weren’t sure what we’d find, but it ended up being some of the best places to live in the state. The richest cities in Kentucky are Prospect, Union, and Hurstbourne, and when you look at the data they sit at the very top of the income ladder for everyone who lives there.
Breaking into the top ten takes a median household income of at least $86,310. If you’re curious about the other end of the ledger, the poorest places are listed to the right.