
Some of you might be asking yourself, at this very moment, is Mississippi a good place?
The answer is unequivocally yes… if you know where to locate the best counties to live in Mississippi.
Lucky for you, we’re here to help you identify the best counties to live in the Magnolia State based on the most recently available data from the Census. And this isn’t our first rodeo — we’ve been using Saturday Night Science to rank places for years.
The question becomes if you wanted to relocate to the best part of Mississippi, where would you go? To answer that, we looked at crime, cost of living, and demographic data for all 82 counties in the state.
Table Of Contents: Top Ten | Methodology | Table | FAQs | Summary
The 10 Best Counties To Live In Mississippi For 2025
- DeSoto County
- Madison County
- Rankin County
- Lafayette County
- Hancock County
- Lee County
- Itawamba County
- Lamar County
- Lowndes County
- Jackson County
Desoto County is the county to be when it comes to living the good life in Mississippi. And you should avoid Quitman County if you can — at least according to the data.
Now you know exactly where to move in Mississippi. Keep on reading for more about the top ten and a detailed methodology.
Or, check out the best places to live in Mississippi and the cheapest places to live in Mississippi.
Table Of Contents: Top Ten | Methodology | Summary | Table
The Best Counties To Live In Mississippi For 2025
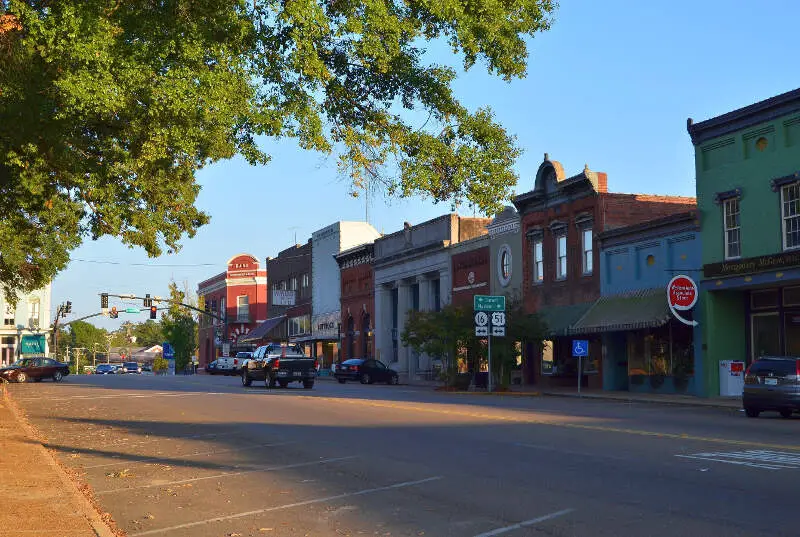
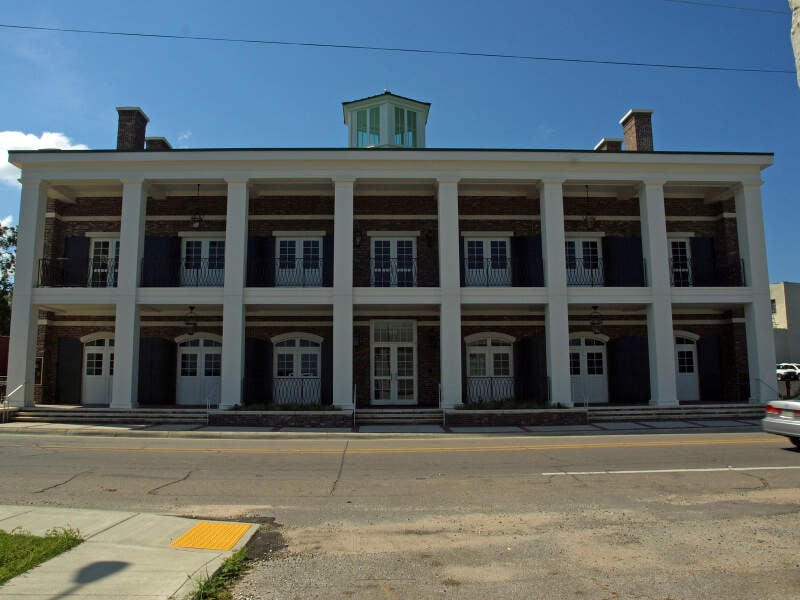
1. Desoto County

Biggest Place: Southaven
Population: 188,598
Median Income: $82,980 (best)
Median Home Price: $248,700 (3rd best)
Unemployment Rate: 3.7% (11th best)
More on Desoto County:
2. Madison County
Biggest Place: Jackson
Population: 110,303
Median Income: $78,794 (2nd best)
Median Home Price: $286,300 (best)
Unemployment Rate: 4.4% (20th best)
More on Madison County:
3. Rankin County

Biggest Place: Jackson
Population: 158,218
Median Income: $77,454 (3rd best)
Median Home Price: $223,400 (4th best)
Unemployment Rate: 4.2% (16th best)
More on Rankin County:
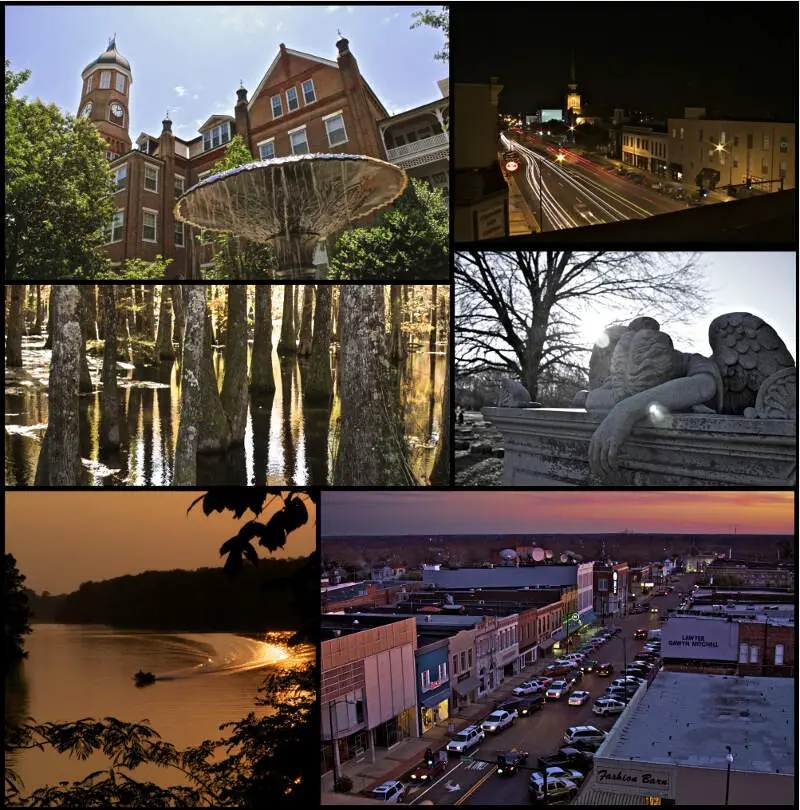
4. Lafayette County

Biggest Place: Oxford
Population: 56,920
Median Income: $64,334 (8th best)
Median Home Price: $260,500 (2nd best)
Unemployment Rate: 1.8% (best)
More on Lafayette County:
5. Hancock County

Biggest Place: Bay St. Louis
Population: 46,057
Median Income: $67,728 (5th best)
Median Home Price: $206,600 (7th best)
Unemployment Rate: 5.3% (30th best)
More on Hancock County:
6. Lee County
Biggest Place: Tupelo
Population: 83,138
Median Income: $67,144 (6th best)
Median Home Price: $187,800 (9th best)
Unemployment Rate: 5.1% (26th best)
More on Lee County:
7. Itawamba County
Biggest Place: Fulton
Population: 23,942
Median Income: $59,508 (11th best)
Median Home Price: $122,400 (33rd best)
Unemployment Rate: 2.9% (4th best)
More on Itawamba County:
8. Lamar County

Biggest Place: Hattiesburg
Population: 65,081
Median Income: $69,106 (4th best)
Median Home Price: $218,700 (6th best)
Unemployment Rate: 5.2% (27th best)
More on Lamar County:
9. Lowndes County
Biggest Place: Columbus
Population: 58,187
Median Income: $54,460 (20th best)
Median Home Price: $157,400 (17th best)
Unemployment Rate: 6.1% (40th best)
More on Lowndes County:
10. Jackson County
Biggest Place: Pascagoula
Population: 144,437
Median Income: $64,756 (7th best)
Median Home Price: $181,700 (10th best)
Unemployment Rate: 7.4% (52nd best)
More on Jackson County:
Methodology: How do you determine which Mississippi county is the best?
To give you the best county in Mississippi, we have to look at a handful of metrics that signal the quality of a place. To do that, we made assumptions about what’s in a “best county” and what isn’t. For reference, we are trying to make the kind of argument you’d make at a bar using facts, Saturday Night Science.
With that in mind, we went to two of the best data sources on the internet. Namely, the American Community Survey data and FBI Crime data for the most recent period.
We paid particular attention to:
- Violent Crime Rates
- Property Crime Rates
- Median Home Values
- Median Income
- Unemployment Rates
- Adult Education Levels
- Health Insurance Coverage
- Poverty Rates
We then ranked each county in Mississippi across each of the criteria from one to 82, with one being the best.
Taking the average rank across all criteria, we created a quality of life score with the county posting the lowest overall score being the “Best County To Live In Mississippi.”
The result is some of the safest, quietest, and best counties to raise a family in the Magnolia State.
We updated this article for 2025. This report is our tenth time ranking the best counties to live in Mississippi.
Read on to see why Desoto County is the best county, while Quitman County is probably in contention for being the worst county in Mississippi.
Summary: The Best Counties In Mississippi To Call Home For 2025
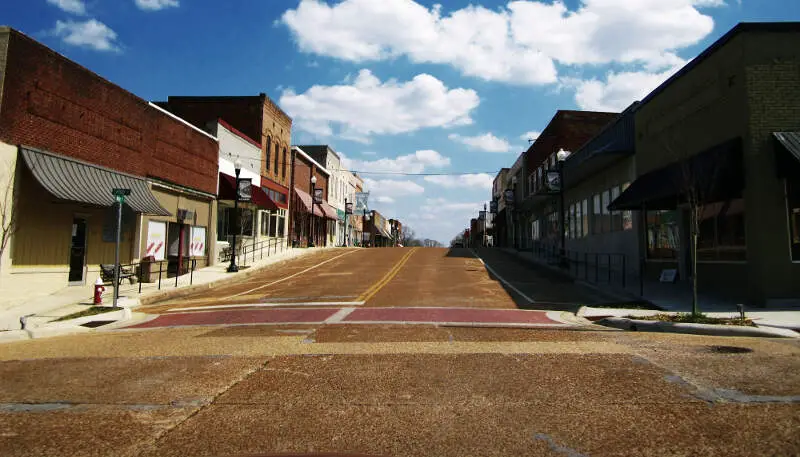
Living in Mississippi can vary from one part of the state to the next — who woulda thought?
The best counties in Mississippi are DeSoto County, Madison County, Rankin County, Lafayette County, Hancock County, Lee County, Itawamba County, Lamar County, Lowndes County, and Jackson County.
But now you know the outstanding parts and the parts to avoid, and that’s why you came here to learn at the end of the day.
You are welcome.
Here’s a look at the worst counties in Mississippi according to the data:
- Quitman County
- Humphreys County
- Tallahatchie County
For more Mississippi reading, check out:
- Richest Cities In Mississippi
- Best Places To Raise A Family In Mississippi
- Best Counties To Live In Mississippi
- Safest Places In Mississippi
Detailed List Of The Best Counties In Mississippi
| Rank | County | Population | Median Income | Median Home Price |
|---|---|---|---|---|
| 1 | Desoto County | 188,598 | $82,980 | $248,700 |
| 2 | Madison County | 110,303 | $78,794 | $286,300 |
| 3 | Rankin County | 158,218 | $77,454 | $223,400 |
| 4 | Lafayette County | 56,920 | $64,334 | $260,500 |
| 5 | Hancock County | 46,057 | $67,728 | $206,600 |
| 6 | Lee County | 83,138 | $67,144 | $187,800 |
| 7 | Itawamba County | 23,942 | $59,508 | $122,400 |
| 8 | Lamar County | 65,081 | $69,106 | $218,700 |
| 9 | Lowndes County | 58,187 | $54,460 | $157,400 |
| 10 | Jackson County | 144,437 | $64,756 | $181,700 |
| 11 | Prentiss County | 24,999 | $51,466 | $116,500 |
| 12 | Jasper County | 16,211 | $47,157 | $118,600 |
| 13 | Warren County | 43,623 | $56,648 | $144,400 |
| 14 | Tate County | 28,135 | $63,995 | $173,000 |
| 15 | Pearl River County | 56,781 | $56,535 | $174,500 |
| 16 | Monroe County | 33,928 | $51,231 | $115,200 |
| 17 | Union County | 28,009 | $56,807 | $159,100 |
| 18 | Forrest County | 78,027 | $52,821 | $152,900 |
| 19 | Stone County | 18,515 | $59,307 | $163,300 |
| 20 | Harrison County | 209,443 | $57,233 | $199,300 |
| 21 | Pontotoc County | 31,312 | $52,741 | $141,700 |
| 22 | Oktibbeha County | 51,473 | $43,482 | $219,500 |
| 23 | Jones County | 66,839 | $51,143 | $126,800 |
| 24 | Tishomingo County | 18,738 | $46,257 | $132,500 |
| 25 | Alcorn County | 34,500 | $49,404 | $132,300 |
| 26 | Lauderdale County | 71,984 | $50,033 | $124,500 |
| 27 | Webster County | 9,942 | $59,964 | $109,500 |
| 28 | Carroll County | 9,828 | $55,275 | $105,500 |
| 29 | George County | 24,870 | $54,822 | $168,100 |
| 30 | Lincoln County | 34,830 | $48,316 | $131,800 |
| 31 | Marshall County | 33,899 | $51,875 | $172,200 |
| 32 | Walthall County | 13,864 | $45,444 | $120,600 |
| 33 | Attala County | 17,685 | $48,098 | $107,600 |
| 34 | Grenada County | 21,342 | $47,998 | $123,400 |
| 35 | Tippah County | 21,621 | $51,141 | $128,400 |
| 36 | Perry County | 11,459 | $50,435 | $126,000 |
| 37 | Covington County | 18,226 | $47,001 | $98,500 |
| 38 | Hinds County | 222,494 | $49,966 | $151,200 |
| 39 | Simpson County | 25,817 | $54,111 | $111,600 |
| 40 | Franklin County | 7,655 | $45,618 | $95,100 |
| 41 | Choctaw County | 8,172 | $48,321 | $104,500 |
| 42 | Newton County | 21,151 | $50,426 | $102,700 |
| 43 | Smith County | 14,193 | $51,396 | $114,000 |
| 44 | Clarke County | 15,424 | $46,054 | $114,300 |
| 45 | Benton County | 7,592 | $42,139 | $109,300 |
| 46 | Montgomery County | 9,708 | $45,057 | $110,700 |
| 47 | Calhoun County | 13,029 | $43,942 | $82,900 |
| 48 | Scott County | 27,754 | $48,492 | $89,900 |
| 49 | Clay County | 18,462 | $39,904 | $115,600 |
| 50 | Chickasaw County | 16,994 | $43,041 | $100,400 |
| 51 | Copiah County | 27,994 | $47,994 | $105,600 |
| 52 | Winston County | 17,609 | $49,071 | $121,200 |
| 53 | Yalobusha County | 12,439 | $49,171 | $97,200 |
| 54 | Leake County | 21,288 | $48,418 | $114,600 |
| 55 | Jefferson Davis County | 11,183 | $37,183 | $87,100 |
| 56 | Amite County | 12,611 | $35,385 | $89,800 |
| 57 | Panola County | 32,965 | $43,990 | $121,500 |
| 58 | Jefferson County | 7,127 | $36,207 | $81,400 |
| 59 | Adams County | 29,098 | $40,250 | $106,300 |
| 60 | Marion County | 24,303 | $42,320 | $117,000 |
| 61 | Neshoba County | 28,927 | $53,087 | $96,600 |
| 62 | Pike County | 39,930 | $41,578 | $110,500 |
| 63 | Bolivar County | 30,163 | $37,315 | $123,600 |
| 64 | Greene County | 13,595 | $55,838 | $94,200 |
| 65 | Issaquena County | 1,095 | $29,271 | $90,700 |
| 66 | Lawrence County | 11,883 | $43,368 | $104,600 |
| 67 | Tunica County | 9,586 | $38,402 | $154,500 |
| 68 | Wilkinson County | 8,376 | $35,930 | $80,200 |
| 69 | Yazoo County | 26,837 | $40,974 | $129,200 |
| 70 | Holmes County | 16,491 | $29,434 | $76,500 |
| 71 | Wayne County | 19,699 | $36,791 | $88,000 |
| 72 | Washington County | 43,674 | $40,117 | $99,300 |
| 73 | Sunflower County | 25,328 | $40,265 | $103,400 |
| 74 | Kemper County | 8,855 | $43,595 | $90,200 |
| 75 | Leflore County | 27,432 | $33,188 | $98,200 |
| 76 | Coahoma County | 20,808 | $36,259 | $86,400 |
| 77 | Noxubee County | 10,136 | $38,814 | $85,200 |
| 78 | Claiborne County | 8,908 | $34,371 | $80,800 |
| 79 | Sharkey County | 3,848 | $35,741 | $108,000 |
| 80 | Tallahatchie County | 12,363 | $37,383 | $82,200 |
| 81 | Humphreys County | 7,570 | $32,976 | $88,800 |
| 82 | Quitman County | 5,908 | $32,131 | $68,600 |