Oxford SnackAbility
Overall SnackAbility
Crime in Oxford summary. We use data from the FBI to determine the crime rates in Oxford. Key points include:
There were 545 total crimes in Oxford in the last reporting year.
The overall crime rate per 100,000 people in Oxford is 1,979.7 / 100k people.
The violent crime rate per 100,000 people in Oxford is 127.1 / 100k people.
The property crime rate per 100,000 people in Oxford is 1,852.6 / 100k people.
Overall, crime in Oxford is -6.58% below the national average.
Total Crimes
Below National Average
Crime In Oxford Comparison Table
| Statistic | Count Raw |
Oxford / 100k People |
Mississippi / 100k People |
National / 100k People |
|---|---|---|---|---|
| Total Crimes Per 100K | 545 | 1,979.7 | 1,573.5 | 2,119.2 |
| Violent Crime | 35 | 127.1 | 210.5 | 359.0 |
| Murder | 1 | 3.6 | 7.4 | 5.0 |
| Robbery | 2 | 7.3 | 18.5 | 61.0 |
| Aggravated Assault | 22 | 79.9 | 155.4 | 256.0 |
| Property Crime | 510 | 1,852.6 | 1,363.0 | 1,760.0 |
| Burglary | 37 | 134.4 | 235.2 | 229.0 |
| Larceny | 458 | 1,663.7 | 982.5 | 1,272.0 |
| Car Theft | 15 | 54.5 | 145.3 | 259.0 |
Source: FBI Uniform Crime Reporting (2024)
Cost of living in Oxford summary. We use data on the cost of living to determine how expensive it is to live in Oxford. Real estate prices drive most of the variance in cost of living around Mississippi. Key points include:
The cost of living in Oxford is 107 with 100 being average.
The cost of living in Oxford is 1.1x higher than the national average.
The median home value in Oxford is $412,781.
The median income in Oxford is $64,451.
Oxford's Overall Cost Of Living
Higher Than The National Average
Cost Of Living In Oxford Comparison Table
| Living Expense | Oxford | Mississippi | National Average |
|---|---|---|---|
| Overall | 107 | 88 | 100 |
| Services | 97 | 99 | 100 |
| Groceries | 96 | 97 | 100 |
| Health | 134 | 63 | 100 |
| Housing | 91 | 94 | 100 |
| Transportation | 101 | 97 | 100 |
| Utilities | 93 | 93 | 100 |
Source: Cost of living index, normalized to US average = 100
Oxford, MS Weather
The average high in Oxford is 72.4° and the average low is 49.6°.
There are 74.8 days of precipitation each year.
Expect an average of 57.6 inches of precipitation each year with 2.2 inches of snow.
| Stat | Oxford |
|---|---|
| Average Annual High | 72.4 |
| Average Annual Low | 49.6 |
| Annual Precipitation Days | 74.8 |
| Average Annual Precipitation | 57.6 |
| Average Annual Snowfall | 2.2 |
Average High
Days of Rain
Source: NOAA climate normals (30-year)
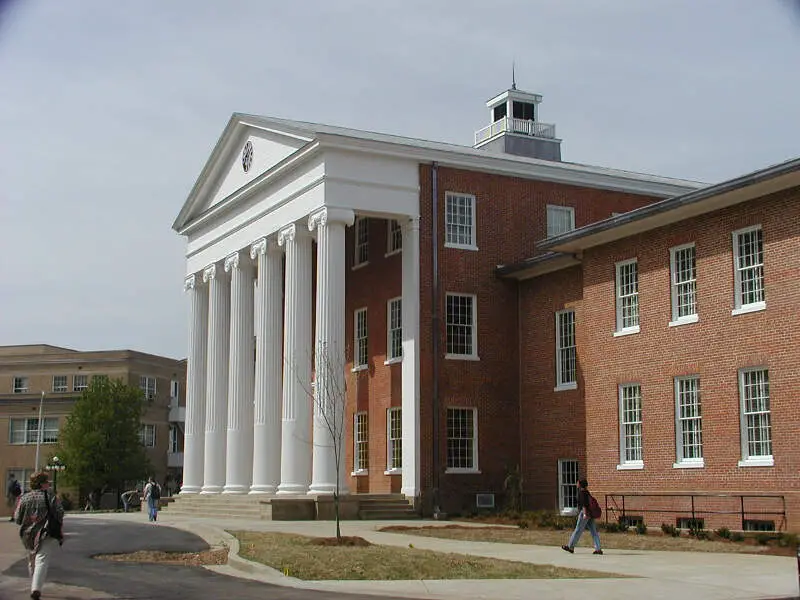
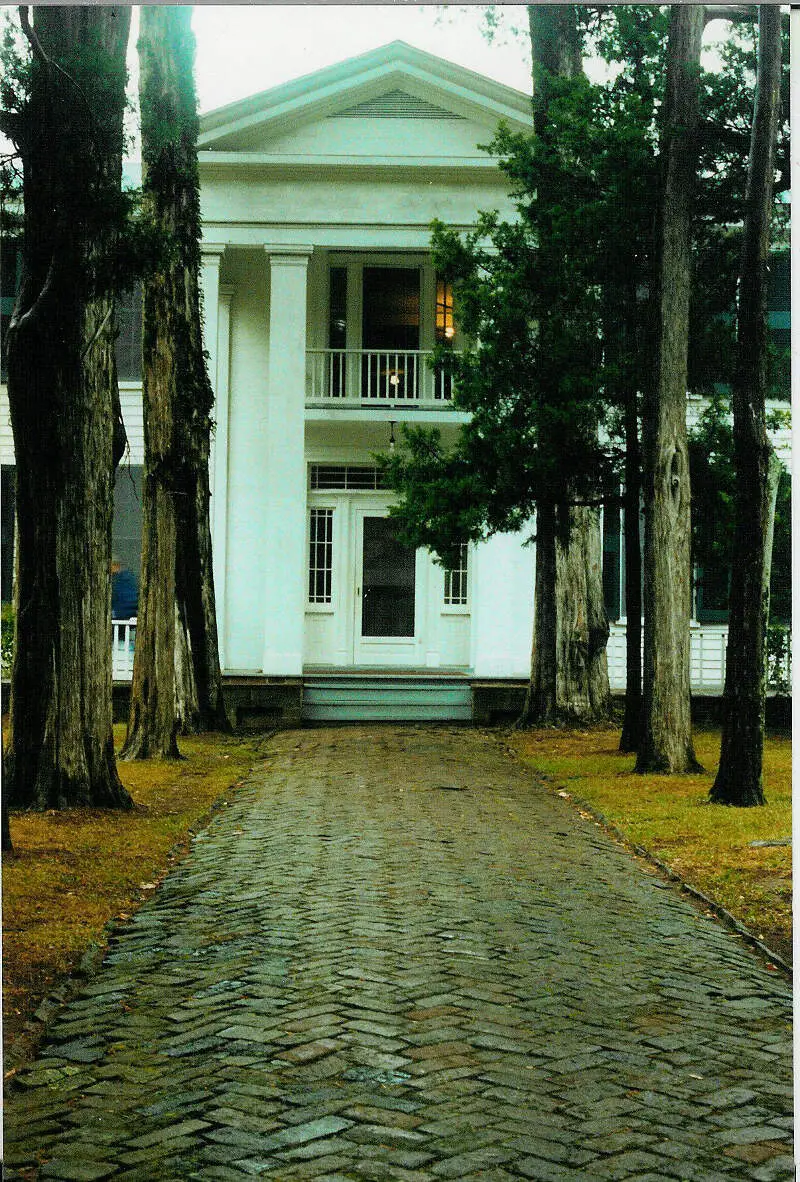
Oxford, MS Photos


Rankings & Articles For Oxford


Locations Around Oxford
Map Of Oxford, MS
Best Places Around Oxford
Collierville, TN
Population 51,515
Southaven, MS
Population 56,226
Olive Branch, MS
Population 47,019
New Albany, MS
Population 7,663
Hernando, MS
Population 17,949
Tupelo, MS
Population 37,791
Ripley, MS
Population 5,377
Pontotoc, MS
Population 5,806
Batesville, MS
Population 7,387
Senatobia, MS
Population 8,380
Oxford Demographics And Statistics
Population over time in Oxford
The current population in Oxford is 26,411. The population has increased 46.8% from 2010.
| Year | Population | % Change |
|---|---|---|
| 2024 | 26,411 | 1.2% |
| 2023 | 26,086 | 1.5% |
| 2022 | 25,713 | -0.6% |
| 2021 | 25,859 | -6.5% |
| 2020 | 27,662 | 2.6% |
| 2019 | 26,962 | 17.0% |
| 2018 | 23,037 | 4.3% |
| 2017 | 22,092 | 2.1% |
| 2016 | 21,634 | 4.2% |
| 2015 | 20,769 | 2.8% |
| 2014 | 20,200 | 3.1% |
| 2013 | 19,602 | 3.0% |
| 2012 | 19,022 | 2.9% |
| 2011 | 18,480 | 2.7% |
| 2010 | 17,990 | - |
Race / Ethnicity in Oxford
See the full breakdown
Oxford is:
64.7% White with 17,091 White residents.
25.5% African American with 6,734 African American residents.
0.1% American Indian with 22 American Indian residents.
2.8% Asian with 729 Asian residents.
0.0% Hawaiian with 0 Hawaiian residents.
0.3% Other with 83 Other residents.
2.6% Two Or More with 698 Two Or More residents.
4.0% Hispanic with 1,054 Hispanic residents.
| Race | Oxford | MS | USA |
|---|---|---|---|
| White | 64.7% | 55.2% | 57.4% |
| African American | 25.5% | 36.3% | 11.9% |
| American Indian | 0.1% | 0.4% | 0.5% |
| Asian | 2.8% | 1.0% | 5.9% |
| Hawaiian | 0.0% | 0.0% | 0.2% |
| Other | 0.3% | 0.3% | 0.6% |
| Two Or More | 2.6% | 3.0% | 4.3% |
| Hispanic | 4.0% | 3.7% | 19.3% |
Gender in Oxford
See the full breakdown
Oxford is 53.6% female with 14,165 female residents.
Oxford is 46.4% male with 12,245 male residents.
| Gender | Oxford | MS | USA |
|---|---|---|---|
| Female | 53.6% | 51.5% | 50.5% |
| Male | 46.4% | 48.5% | 49.5% |
Highest level of educational attainment in Oxford for adults over 25
See the full breakdown
3.0% of adults in Oxford completed < 9th grade.
5.0% of adults in Oxford completed 9-12th grade.
13.0% of adults in Oxford completed high school / ged.
15.0% of adults in Oxford completed some college.
7.0% of adults in Oxford completed associate's degree.
28.0% of adults in Oxford completed bachelor's degree.
17.0% of adults in Oxford completed master's degree.
6.0% of adults in Oxford completed professional degree.
6.0% of adults in Oxford completed doctorate degree.
| Education | Oxford | MS | USA |
|---|---|---|---|
| < 9th Grade | 3.0% | 4.0% | 4.0% |
| 9-12th Grade | 5.0% | 9.0% | 6.0% |
| High School / GED | 13.0% | 30.0% | 26.0% |
| Some College | 15.0% | 21.0% | 19.0% |
| Associate's Degree | 7.0% | 11.0% | 9.0% |
| Bachelor's Degree | 28.0% | 15.0% | 22.0% |
| Master's Degree | 17.0% | 7.0% | 10.0% |
| Professional Degree | 6.0% | 2.0% | 2.0% |
| Doctorate Degree | 6.0% | 1.0% | 2.0% |
Household Income For Oxford, Mississippi
See the full breakdown
10.2% of households in Oxford earn Less than $10,000.
5.5% of households in Oxford earn $10,000 to $14,999.
8.2% of households in Oxford earn $15,000 to $24,999.
9.4% of households in Oxford earn $25,000 to $34,999.
7.8% of households in Oxford earn $35,000 to $49,999.
15.3% of households in Oxford earn $50,000 to $74,999.
11.1% of households in Oxford earn $75,000 to $99,999.
12.5% of households in Oxford earn $100,000 to $149,999.
8.0% of households in Oxford earn $150,000 to $199,999.
11.9% of households in Oxford earn $200,000 or more.
| Income | Oxford | MS | USA |
|---|---|---|---|
| Less than $10,000 | 10.2% | 7.1% | 5.0% |
| $10,000 to $14,999 | 5.5% | 6.0% | 3.4% |
| $15,000 to $24,999 | 8.2% | 10.0% | 6.3% |
| $25,000 to $34,999 | 9.4% | 9.3% | 6.6% |
| $35,000 to $49,999 | 7.8% | 12.7% | 10.1% |
| $50,000 to $74,999 | 15.3% | 16.5% | 15.5% |
| $75,000 to $99,999 | 11.1% | 12.0% | 12.6% |
| $100,000 to $149,999 | 12.5% | 14.4% | 17.5% |
| $150,000 to $199,999 | 8.0% | 6.2% | 9.6% |
| $200,000 or more | 11.9% | 5.8% | 13.4% |
Source: U.S. Census ACS 5-year estimates (2024)


