
Some of you might be asking yourself, at this very moment, is North Dakota a good place?
The answer is unequivocally yes… if you know where to locate the best counties to live in North Dakota.
Lucky for you, we’re here to help you identify the best counties to live in the Peace Garden State based on the most recently available data from the Census. And this isn’t our first rodeo — we’ve been using Saturday Night Science to rank places for years.
The question becomes if you wanted to relocate to the best part of North Dakota, where would you go? To answer that, we looked at crime, cost of living, and demographic data for all 53 counties in the state.
Table Of Contents: Top Ten | Methodology | Table | FAQs | Summary
The 10 Best Counties To Live In North Dakota For 2025
- Oliver County
- Morton County
- Burleigh County
- Foster County
- Billings County
- Sargent County
- Bottineau County
- Traill County
- McLean County
- Burke County
Oliver County is the county to be when it comes to living the good life in North Dakota. And you should avoid Sioux County if you can — at least according to the data.
Now you know exactly where to move in North Dakota. Keep on reading for more about the top ten and a detailed methodology.
Or, check out the best places to live in North Dakota and the cheapest places to live in North Dakota.
Table Of Contents: Top Ten | Methodology | Summary | Table
The Best Counties To Live In North Dakota For 2025
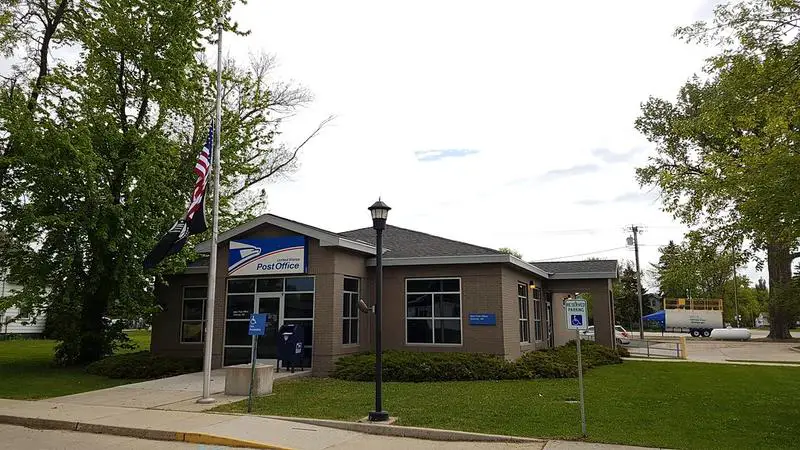
1. Oliver County
Biggest Place: Center
Population: 1,821
Median Income: $76,953 (2best)
Median Home Price: $217,000 (13th best)
Unemployment Rate: 0.9% (3rd best)
More on Oliver County:
2. Morton County
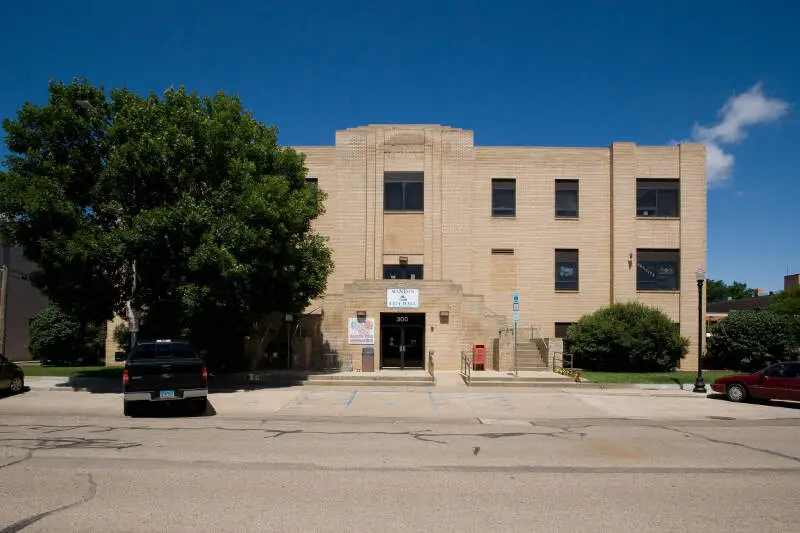
Biggest Place: Mandan
Population: 33,479
Median Income: $79,483 (17th best)
Median Home Price: $249,600 (8th best)
Unemployment Rate: 1.4% (12th best)
More on Morton County:
3. Burleigh County
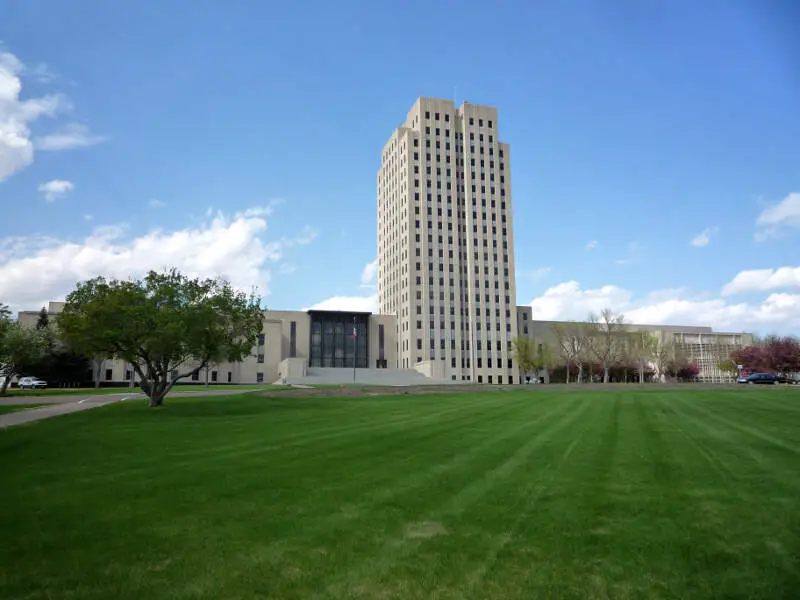
Biggest Place: Bismarck
Population: 98,986
Median Income: $84,948 (7th best)
Median Home Price: $314,700 (3rd best)
Unemployment Rate: 3.1% (38th best)
More on Burleigh County:
4. Foster County
Biggest Place: Carrington
Population: 3,372
Median Income: $83,412 (10th best)
Median Home Price: $162,800 (26th best)
Unemployment Rate: 0.1% (best)
More on Foster County:
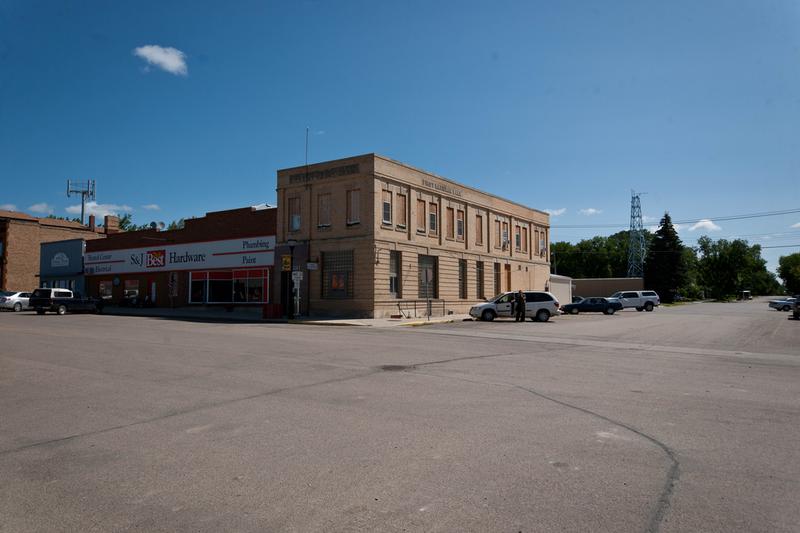
5. Billings County
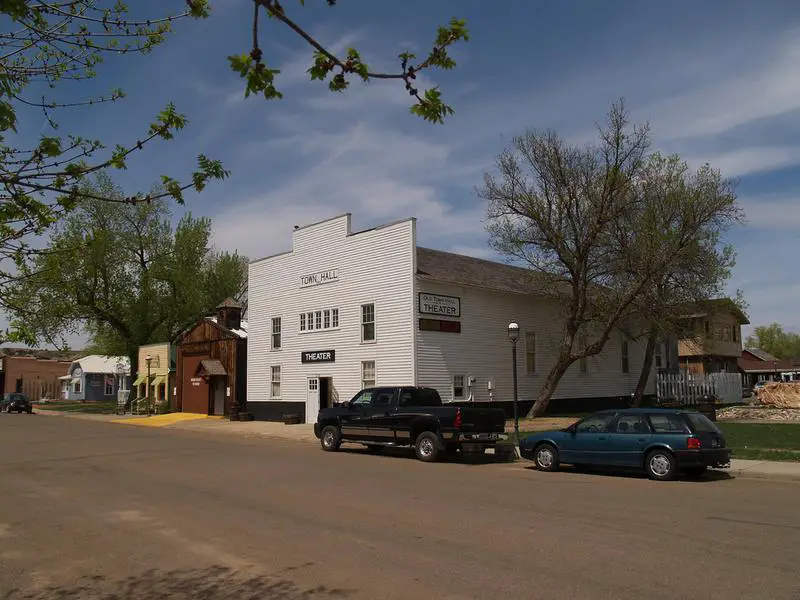
Biggest Place: Medora
Population: 948
Median Income: $81,250 (13th best)
Median Home Price: $322,500 (2nd best)
Unemployment Rate: 1.6% (19th best)
More on Billings County:
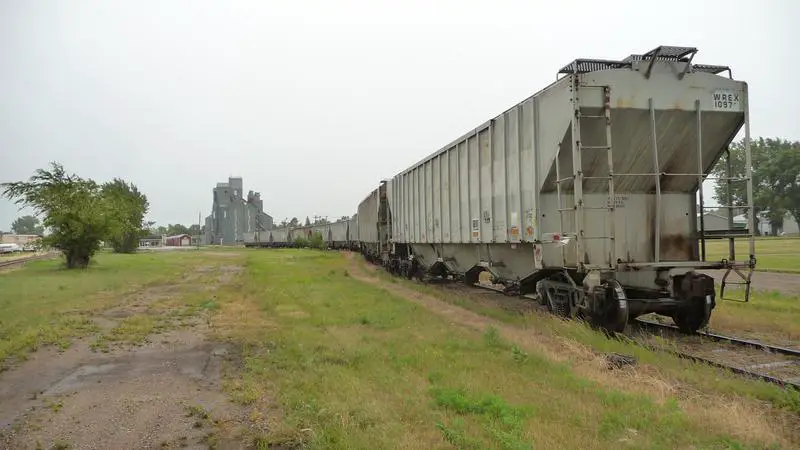
6. Sargent County
Biggest Place: Gwinner
Population: 3,822
Median Income: $77,697 (20th best)
Median Home Price: $149,600 (27th best)
Unemployment Rate: 1.1% (8th best)
More on Sargent County:
7. Bottineau County

Biggest Place: Bottineau
Population: 6,390
Median Income: $83,460 (9th best)
Median Home Price: $190,900 (18th best)
Unemployment Rate: 1.6% (17th best)
More on Bottineau County:
8. Traill County
Biggest Place: Mayville
Population: 7,980
Median Income: $88,289 (5th best)
Median Home Price: $193,200 (17th best)
Unemployment Rate: 2.2% (30th best)
More on Traill County:
9. Mclean County
Biggest Place: Garrison
Population: 9,807
Median Income: $81,847 (11th best)
Median Home Price: $233,100 (11th best)
Unemployment Rate: 1.6% (16th best)
More on Mclean County:
10. Burke County
Biggest Place: Bowbells
Population: 2,163
Median Income: $96,339 (best)
Median Home Price: $141,900 (30th best)
Unemployment Rate: 4.4% (47th best)
More on Burke County:
Methodology: How do you determine which North Dakota county is the best?
To give you the best county in North Dakota, we have to look at a handful of metrics that signal the quality of a place. To do that, we made assumptions about what’s in a “best county” and what isn’t. For reference, we are trying to make the kind of argument you’d make at a bar using facts, Saturday Night Science.
With that in mind, we went to two of the best data sources on the internet. Namely, the American Community Survey data and FBI Crime data for the most recent period.
We paid particular attention to:
- Violent Crime Rates
- Property Crime Rates
- Median Home Values
- Median Income
- Unemployment Rates
- Adult Education Levels
- Health Insurance Coverage
- Poverty Rates
We then ranked each county in North Dakota across each of the criteria from one to 53, with one being the best.
Taking the average rank across all criteria, we created a quality of life score with the county posting the lowest overall score being the “Best County To Live In North Dakota.”
The result is some of the safest, quietest, and best counties to raise a family in the Peace Garden State.
We updated this article for 2025. This report is our tenth time ranking the best counties to live in North Dakota.
Read on to see why Oliver County is the best county, while Sioux County is probably in contention for being the worst county in North Dakota.
Summary: The Best Counties In North Dakota To Call Home For 2025
Living in North Dakota can vary from one part of the state to the next — who woulda thought?
The best counties in North Dakota are Oliver County, Morton County, Burleigh County, Foster County, Billings County, Sargent County, Bottineau County, Traill County, McLean County, and Burke County.
But now you know the outstanding parts and the parts to avoid, and that’s why you came here to learn at the end of the day.
You are welcome.
Here’s a look at the worst counties in North Dakota according to the data:
- Sioux County
- Rolette County
- Grant County
For more North Dakota reading, check out:
- Best Places To Retire In North Dakota
- Safest Places In North Dakota
- Best Places To Raise A Family In North Dakota
- Cheapest Places To Live In North Dakota
Detailed List Of The Best Counties In North Dakota
| Rank | County | Population | Median Income | Median Home Price |
|---|---|---|---|---|
| 1 | Oliver County | 1,821 | $76,953 | $217,000 |
| 2 | Morton County | 33,479 | $79,483 | $249,600 |
| 3 | Burleigh County | 98,986 | $84,948 | $314,700 |
| 4 | Foster County | 3,372 | $83,412 | $162,800 |
| 5 | Billings County | 948 | $81,250 | $322,500 |
| 6 | Sargent County | 3,822 | $77,697 | $149,600 |
| 7 | Bottineau County | 6,390 | $83,460 | $190,900 |
| 8 | Traill County | 7,980 | $88,289 | $193,200 |
| 9 | Mclean County | 9,807 | $81,847 | $233,100 |
| 10 | Burke County | 2,163 | $96,339 | $141,900 |
| 11 | Renville County | 2,277 | $76,311 | $163,400 |
| 12 | Cavalier County | 3,663 | $67,064 | $122,300 |
| 13 | Ward County | 69,232 | $79,273 | $259,100 |
| 14 | Dunn County | 4,043 | $94,688 | $244,000 |
| 15 | Cass County | 189,286 | $75,023 | $284,700 |
| 16 | Nelson County | 3,015 | $68,051 | $114,500 |
| 17 | Richland County | 16,550 | $72,524 | $177,600 |
| 18 | Mckenzie County | 14,280 | $88,289 | $357,300 |
| 19 | Williams County | 39,368 | $90,224 | $267,800 |
| 20 | Ransom County | 5,662 | $74,521 | $174,800 |
| 21 | Barnes County | 10,794 | $70,230 | $168,100 |
| 22 | Kidder County | 2,374 | $61,850 | $138,500 |
| 23 | Grand Forks County | 72,764 | $68,450 | $244,200 |
| 24 | Griggs County | 2,340 | $64,737 | $128,200 |
| 25 | Steele County | 1,731 | $80,313 | $120,400 |
| 26 | Stark County | 33,116 | $80,744 | $260,400 |
| 27 | Golden Valley County | 1,679 | $76,528 | $119,200 |
| 28 | Divide County | 2,174 | $89,297 | $173,100 |
| 29 | Mercer County | 8,341 | $79,405 | $196,200 |
| 30 | Pierce County | 3,961 | $63,214 | $143,400 |
| 31 | Sheridan County | 1,327 | $67,361 | $107,700 |
| 32 | Bowman County | 2,935 | $83,773 | $176,400 |
| 33 | Slope County | 795 | $62,500 | $121,300 |
| 34 | Lamoure County | 4,107 | $70,263 | $118,000 |
| 35 | Stutsman County | 21,525 | $60,172 | $200,300 |
| 36 | Hettinger County | 2,453 | $70,827 | $110,900 |
| 37 | Wells County | 3,942 | $61,346 | $106,400 |
| 38 | Logan County | 1,848 | $61,339 | $101,800 |
| 39 | Towner County | 2,113 | $63,017 | $122,800 |
| 40 | Emmons County | 3,269 | $67,368 | $112,400 |
| 41 | Mchenry County | 5,264 | $80,614 | $143,200 |
| 42 | Mountrail County | 9,567 | $81,292 | $222,200 |
| 43 | Ramsey County | 11,563 | $61,319 | $197,400 |
| 44 | Pembina County | 6,787 | $66,884 | $116,600 |
| 45 | Dickey County | 4,959 | $63,125 | $167,100 |
| 46 | Walsh County | 10,488 | $69,976 | $125,700 |
| 47 | Eddy County | 2,319 | $55,389 | $115,500 |
| 48 | Mcintosh County | 2,512 | $64,236 | $80,300 |
| 49 | Adams County | 2,179 | $55,417 | $108,300 |
| 50 | Benson County | 5,861 | $68,049 | $83,100 |
| 51 | Grant County | 2,276 | $56,750 | $85,800 |
| 52 | Rolette County | 12,065 | $57,355 | $93,000 |
| 53 | Sioux County | 3,789 | $41,676 | $87,400 |