
What’s the best part of Irvine?
It could be where everyone knows their neighbor. Or it could be where home prices are the highest, meaning it’s where everyone wants to live.
Instead of relying on public opinion and speculation, we wanted to get the facts straight and find out which neighborhoods in Irvine are the best based on Saturday Night Science.
Whether you live in the sticks or in an apartment building downtown, you want a little pocket that you can call home. And each neighborhood offers different perks and benefits.
Smaller neighborhoods usually have obvious benefits — less crime, a slower pace of life, and a lower cost of living. But not all Irvine neighborhoods are created equal. Some are better than others. But which ones?
If you’re thinking of moving to California and Irvine is on the top of your list, check out the best neighborhoods for 2025.
Table Of Contents: Top Ten | Methodology | Summary | Table
So what’s the best neighborhood to live in Irvine for 2025? According to the most recent census data, Northwood Point looks to be the best Irvine neighborhood to live in.
Read on to see how we determined the places around Irvine that deserve a little bragging rights, or maybe you’re interested in the worst neighborhoods in Irvine.
For more California reading, check out:
- Best Places To Live In California
- Cheapest Places To Live In California
- Most Dangerous Cities In California
The 10 Best Neighborhoods To Live In Irvine
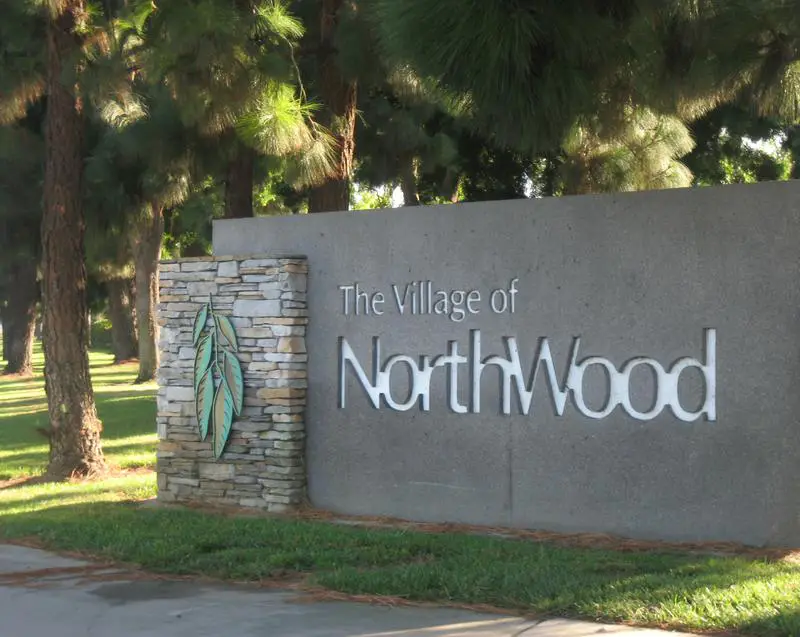
1. Northwood Point
Population: 7,561
Median Home Value: $1,220,300 (Third best)
Median Income: $165,372 (Fourth best)
More on Northwood Point:
2. Turtle Ridge
Population: 2,295
Median Home Value: $908,100 (Ninth best)
Median Income: $178,974 (Second best)
More on Turtle Ridge:
3. Shady Canyon
Population: 777
Median Home Value: $1,074,500 (Fifth best)
Median Income: $170,363 (Third best)
More on Shady Canyon:
4. Turtle Rock

Population: 10,186
Median Home Value: $1,221,012 (Second best)
Median Income: $131,074 (Ninth best)
More on Turtle Rock:
5. West Park
Population: 22,993
Median Home Value: $815,446 (Tenth best)
Median Income: $129,158 (Tenth best)
More on West Park:
6. University Park
Population: 7,885
Median Home Value: $732,950 (17th best)
Median Income: $115,890 (11th best)
More on University Park:
7. Quail Hill
Population: 7,651
Median Home Value: $1,367,400 (best)
Median Income: $225,050 (best)
More on Quail Hill:
8. Northwood
Population: 22,218
Median Home Value: $798,725 (11th best)
Median Income: $111,899 (15th best)
More on Northwood:
9. Oak Creek
Population: 10,018
Median Home Value: $768,160 (14th best)
Median Income: $114,778 (12th best)
More on Oak Creek:
10. El Toro Marine Air Station
Population: 5,237
Median Home Value: $1,082,050 (Fourth best)
Median Income: $159,791 (Fifth best)
More on El Toro Marine Air Station:
Methodology: How We Determined The Best Irvine, CA Neighborhoods In 2025
To rank the best neighborhoods in Irvine, we had to determine what criteria define “best” and then apply Saturday Night Science to it.
Using FBI crime, Census, and extrapolated BLS data, we arrived at the following set of criteria:
- High incomes
- Low unemployment rates
- Low crime
- High home prices
- High population densities (A proxy for things to do)
We then ranked each neighborhood with scores from 1 to 23 in each category, where 1 was the best.
Next, we averaged the rankings for each neighborhood to create a best neighborhood index.
And finally, we crowned the neighborhood with the lowest best neighborhood index, the “Best City Neighborhood In Irvine.” We’re lookin’ at you, Northwood Point.
Read on below to learn more about what it’s like to live in the best places Irvine, California has to offer. Or skip to the end to see the list of all the neighborhoods in the city, from best to worst.
We updated this article for 2025. This report is our tenth time ranking the best neighborhoods to live in Irvine.
Summary: Putting A Bow On Our Analysis Of The Best Neighborhoods In Irvine
If you’re measuring the neighborhoods in Irvine where crime is low and everyone wants to live, this is an accurate list.
The best neighborhoods in Irvine are Northwood Point, Turtle Ridge, Shady Canyon, Turtle Rock, West Park, University Park, Quail Hill, Northwood, Oak Creek, and El Toro Marine Air Station.
As mentioned earlier, the neighborhoods in Irvine aren’t all good. San Joaquin Marsh takes the title of the worst neighborhood to live in Irvine.
The worst neighborhoods in Irvine are San Joaquin Marsh, Irvine Health And Science Complex, Great Park, Rancho San Joaquin, and Business District.
We ranked the neighborhoods from best to worst in the chart below.
For more California reading, check out:
Best Neighborhoods To Live In Irvine For 2025 Detailed Data
| Rank | Neighborhood | Population | Home Value | Median Income |
|---|---|---|---|---|
| 1 | Northwood Point | 7,561 | $1,220,300 | $165,372 |
| 2 | Turtle Ridge | 2,295 | $908,100 | $178,974 |
| 3 | Shady Canyon | 777 | $1,074,500 | $170,363 |
| 4 | Turtle Rock | 10,186 | $1,221,012 | $131,074 |
| 5 | West Park | 22,993 | $815,446 | $129,158 |
| 6 | University Park | 7,885 | $732,950 | $115,890 |
| 7 | Quail Hill | 7,651 | $1,367,400 | $225,050 |
| 8 | Northwood | 22,218 | $798,725 | $111,899 |
| 9 | Oak Creek | 10,018 | $768,160 | $114,778 |
| 10 | El Toro Marine Air Station | 5,237 | $1,082,050 | $159,791 |
| 11 | Woodbridge | 24,966 | $745,050 | $114,407 |
| 12 | Walnut Village | 7,675 | $770,450 | $136,378 |
| 13 | Uc Irvine | 15,807 | $502,167 | $103,800 |
| 14 | Lower Peters Canyon | 18,938 | $759,843 | $112,733 |
| 15 | El Camino Real | 15,999 | $687,291 | $104,550 |
| 16 | Spectrum | 9,610 | $969,175 | $133,208 |
| 17 | East Industrial Complex | 2,182 | $777,833 | $131,326 |
| 18 | University Town Center | 6,421 | $569,733 | $40,539 |
| 19 | Business District | 15,635 | $721,271 | $93,495 |
| 20 | Rancho San Joaquin | 4,512 | $641,200 | $58,520 |
| 21 | Great Park | 235 | $918,700 | $54,286 |
| 22 | Irvine Health And Science Complex | 8,644 | $918,700 | $88,519 |
| 23 | San Joaquin Marsh | 412 | $607,300 | $58,820 |