Compare Irvine to…
Irvine SnackAbility
Overall SnackAbility
Crime in Irvine summary. We use data from the FBI to determine the crime rates in Irvine. Key points include:
There were 4,668 total crimes in Irvine in the last reporting year.
The overall crime rate per 100,000 people in Irvine is 1,473.7 / 100k people.
The violent crime rate per 100,000 people in Irvine is 84.0 / 100k people.
The property crime rate per 100,000 people in Irvine is 1,389.7 / 100k people.
Overall, crime in Irvine is -30.46% below the national average.
Total Crimes
Below National Average
Crime In Irvine Comparison Table
| Statistic | Count Raw |
Irvine / 100k People |
California / 100k People |
National / 100k People |
|---|---|---|---|---|
| Total Crimes Per 100K | 4,668 | 1,473.7 | 2,564.5 | 2,119.2 |
| Violent Crime | 266 | 84.0 | 486.0 | 359.0 |
| Murder | 5 | 1.6 | 4.5 | 5.0 |
| Robbery | 70 | 22.1 | 119.1 | 61.0 |
| Aggravated Assault | 149 | 47.0 | 325.8 | 256.0 |
| Property Crime | 4,402 | 1,389.7 | 2,078.4 | 1,760.0 |
| Burglary | 627 | 197.9 | 305.8 | 229.0 |
| Larceny | 3,554 | 1,122.0 | 1,345.2 | 1,272.0 |
| Car Theft | 221 | 69.8 | 427.5 | 259.0 |
Source: FBI Uniform Crime Reporting (2024)
Cost of living in Irvine summary. We use data on the cost of living to determine how expensive it is to live in Irvine. Real estate prices drive most of the variance in cost of living around California. Key points include:
The cost of living in Irvine is 209 with 100 being average.
The cost of living in Irvine is 2.1x higher than the national average.
The median home value in Irvine is $1,557,981.
The median income in Irvine is $136,719.
Irvine's Overall Cost Of Living
Higher Than The National Average
Cost Of Living In Irvine Comparison Table
| Living Expense | Irvine | California | National Average |
|---|---|---|---|
| Overall | 209 | 142 | 100 |
| Services | 119 | 110 | 100 |
| Groceries | 120 | 118 | 100 |
| Health | 409 | 197 | 100 |
| Housing | 124 | 120 | 100 |
| Transportation | 125 | 121 | 100 |
| Utilities | 129 | 121 | 100 |
Source: Cost of living index, normalized to US average = 100
Irvine, CA Weather
The average high in Irvine is 74.4° and the average low is 54.4°.
There are 22.9 days of precipitation each year.
Expect an average of 13.3 inches of precipitation each year with 0.0 inches of snow.
| Stat | Irvine |
|---|---|
| Average Annual High | 74.4 |
| Average Annual Low | 54.4 |
| Annual Precipitation Days | 22.9 |
| Average Annual Precipitation | 13.3 |
| Average Annual Snowfall | 0.0 |
Average High
Days of Rain
Source: NOAA climate normals (30-year)
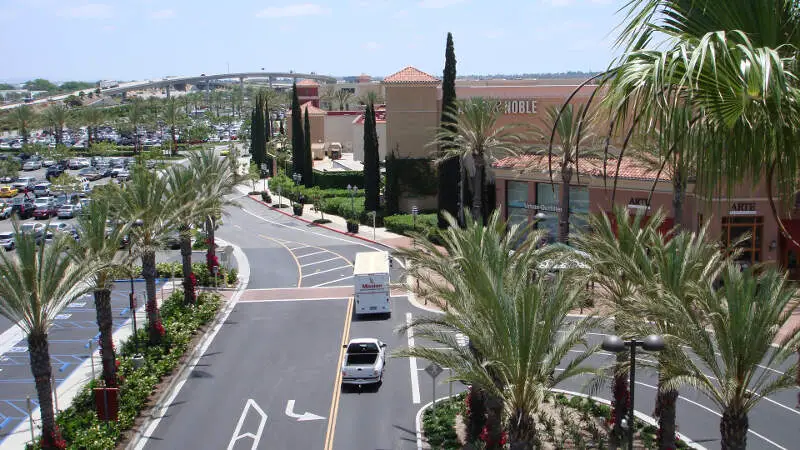
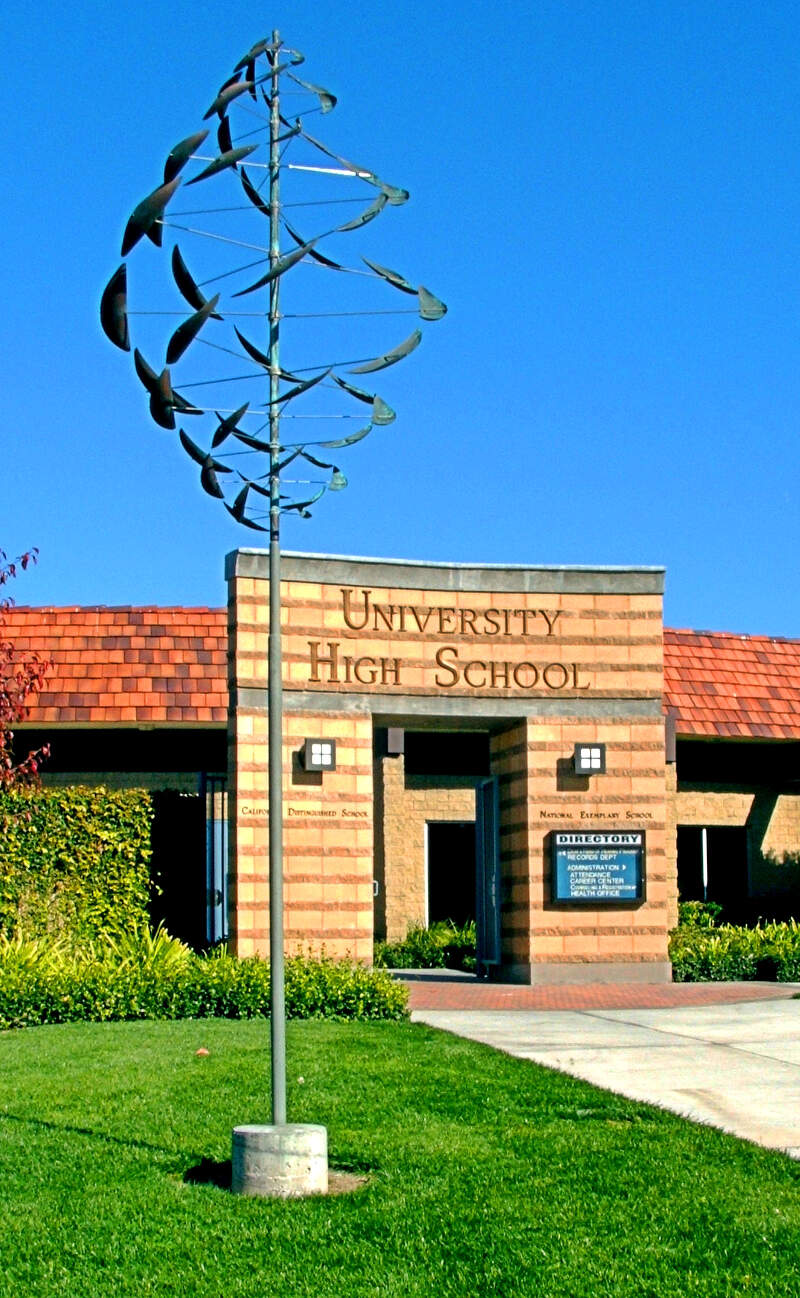
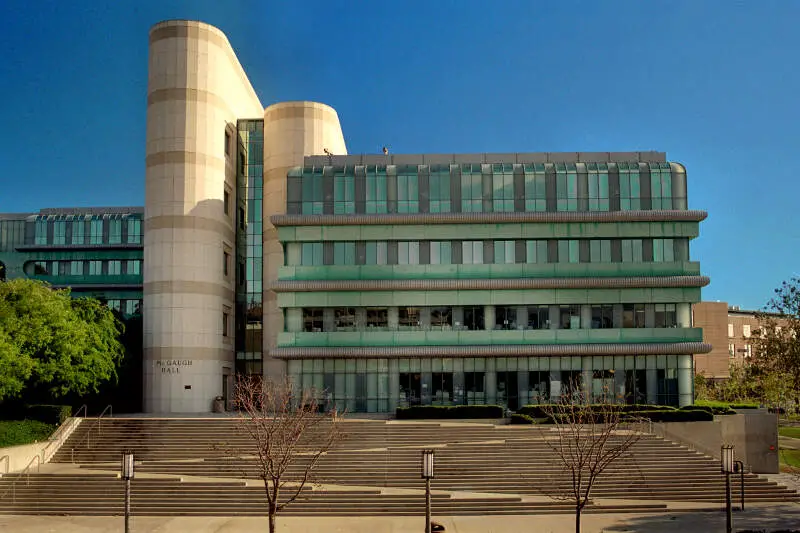
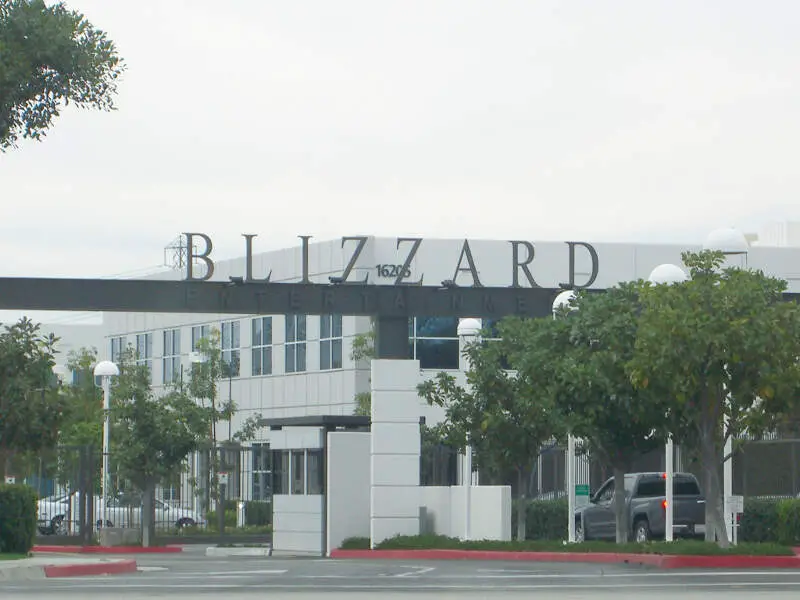
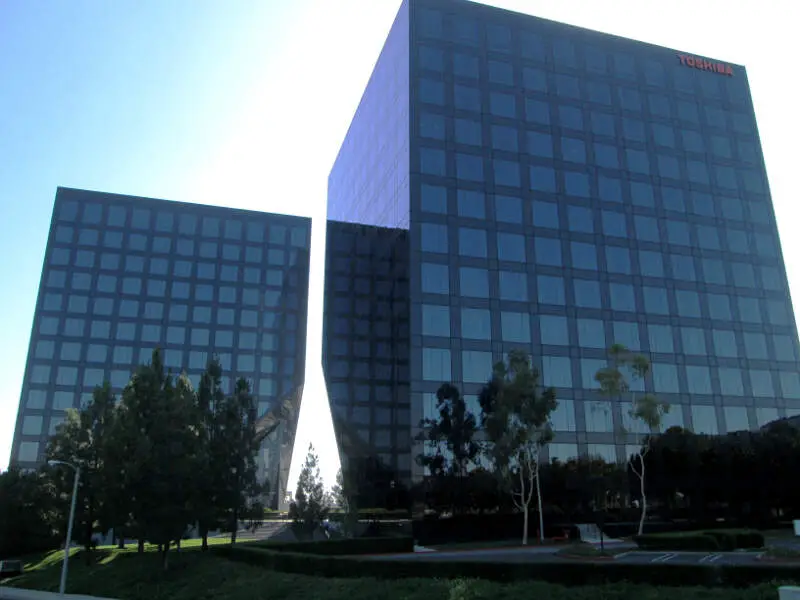
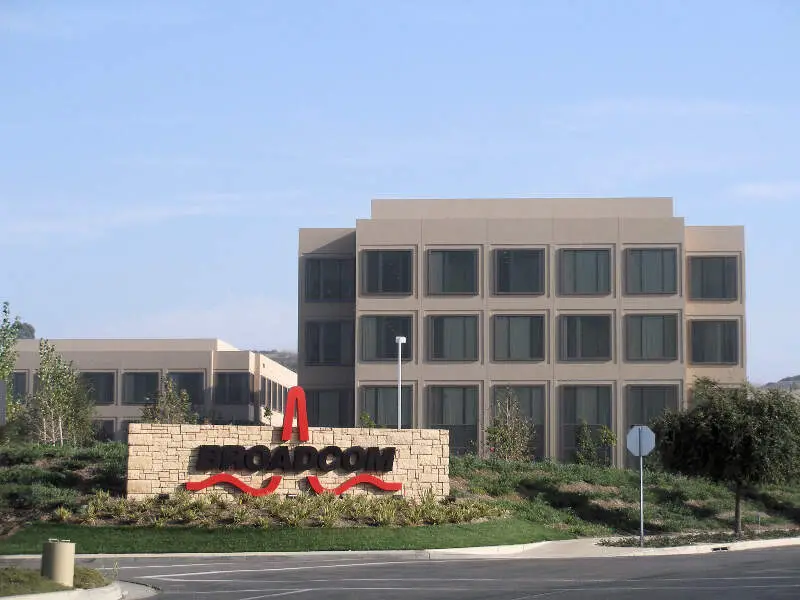
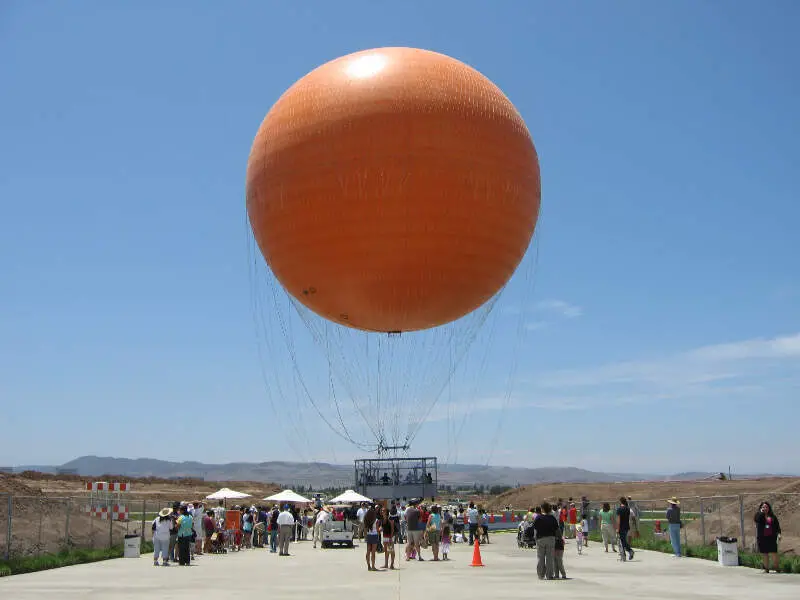
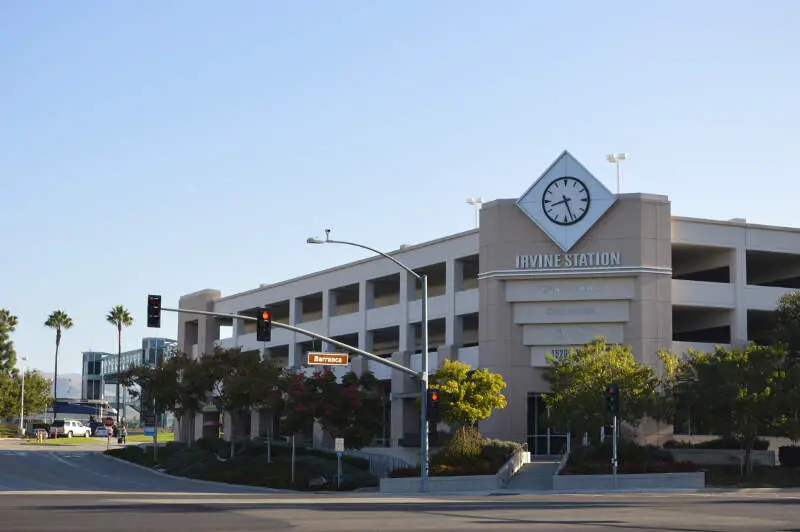
Irvine, CA Photos

2 Reviews & Comments About Irvine

Irvine is an extremely safe city with regular, active, and diligent police patrols on all major roads. It has a reputation for being one of, if not the safest city in America, and is also a beautiful city due to the planned nature of its housing communities and nature. While this does make Irvine feel like a bubble, it also ensures that it is a safe and secure environment for those living in it and especially for children, as they are guaranteed an education that is held to a higher standard than other cities. Schools are consistently excellent, and there are very few schools that are riddled with disciplinary or financial problems due to Irvine Company's excellent management of the city's allocated funding.
Irvine's food is mostly chains, and there are few private businesses due to the high cost of retail spaces. As a result, your experiences in Irvine when it comes to food and shopping will always be consistently safe, but also expensive and somewhat vanilla in terms of variety. The city also begins to feel quite sterile after living there for a few years because of how safe and well-maintained it is. Transportation without a vehicle can also be difficult due to the long intervals between buses, as well as the distance from houses to retail plazas.
Awesome place. Super safe. Plenty of things to do: nature, city, eats, movies, films, and events.
Expensive. Everything you wanna do here is expensive. You need some income.
Rankings & Articles For Irvine


Locations Around Irvine
Map Of Irvine, CA
Best Places Around Irvine
Mission Viejo, CA
Population 92,151
Aliso Viejo, CA
Population 51,113
North Tustin, CA
Population 25,807
Rancho Santa Margarita, CA
Population 46,990
Villa Park, CA
Population 5,748
Cypress, CA
Population 49,498
Lake Forest, CA
Population 86,281
Rossmoor, CA
Population 11,532
Yorba Linda, CA
Population 67,170
La Palma, CA
Population 15,272
Irvine Demographics And Statistics
Population over time in Irvine
The current population in Irvine is 311,690. The population has increased 56.5% from 2010.
| Year | Population | % Change |
|---|---|---|
| 2024 | 311,690 | 1.1% |
| 2023 | 308,160 | 1.2% |
| 2022 | 304,527 | 2.2% |
| 2021 | 297,868 | 9.2% |
| 2020 | 272,694 | -0.2% |
| 2019 | 273,157 | 2.9% |
| 2018 | 265,502 | 3.4% |
| 2017 | 256,877 | 4.0% |
| 2016 | 246,992 | 3.6% |
| 2015 | 238,474 | 3.8% |
| 2014 | 229,850 | 3.9% |
| 2013 | 221,266 | 3.5% |
| 2012 | 213,880 | 4.3% |
| 2011 | 205,057 | 3.0% |
| 2010 | 199,117 | - |
Race / Ethnicity in Irvine
See the full breakdown
Irvine is:
34.3% White with 106,877 White residents.
1.9% African American with 5,970 African American residents.
0.1% American Indian with 294 American Indian residents.
44.6% Asian with 139,049 Asian residents.
0.4% Hawaiian with 1,318 Hawaiian residents.
0.8% Other with 2,535 Other residents.
6.4% Two Or More with 20,010 Two Or More residents.
11.4% Hispanic with 35,637 Hispanic residents.
| Race | Irvine | CA | USA |
|---|---|---|---|
| White | 34.3% | 33.8% | 57.4% |
| African American | 1.9% | 5.2% | 11.9% |
| American Indian | 0.1% | 0.3% | 0.5% |
| Asian | 44.6% | 15.3% | 5.9% |
| Hawaiian | 0.4% | 0.3% | 0.2% |
| Other | 0.8% | 0.6% | 0.6% |
| Two Or More | 6.4% | 4.4% | 4.3% |
| Hispanic | 11.4% | 40.2% | 19.3% |
Gender in Irvine
See the full breakdown
Irvine is 51.2% female with 159,655 female residents.
Irvine is 48.8% male with 152,035 male residents.
| Gender | Irvine | CA | USA |
|---|---|---|---|
| Female | 51.2% | 50.1% | 50.5% |
| Male | 48.8% | 49.9% | 49.5% |
Highest level of educational attainment in Irvine for adults over 25
See the full breakdown
2.0% of adults in Irvine completed < 9th grade.
1.0% of adults in Irvine completed 9-12th grade.
8.0% of adults in Irvine completed high school / ged.
12.0% of adults in Irvine completed some college.
6.0% of adults in Irvine completed associate's degree.
39.0% of adults in Irvine completed bachelor's degree.
21.0% of adults in Irvine completed master's degree.
6.0% of adults in Irvine completed professional degree.
5.0% of adults in Irvine completed doctorate degree.
| Education | Irvine | CA | USA |
|---|---|---|---|
| < 9th Grade | 2.0% | 8.0% | 4.0% |
| 9-12th Grade | 1.0% | 7.0% | 6.0% |
| High School / GED | 8.0% | 20.0% | 26.0% |
| Some College | 12.0% | 19.0% | 19.0% |
| Associate's Degree | 6.0% | 8.0% | 9.0% |
| Bachelor's Degree | 39.0% | 23.0% | 22.0% |
| Master's Degree | 21.0% | 10.0% | 10.0% |
| Professional Degree | 6.0% | 3.0% | 2.0% |
| Doctorate Degree | 5.0% | 2.0% | 2.0% |
Household Income For Irvine, California
See the full breakdown
6.0% of households in Irvine earn Less than $10,000.
1.7% of households in Irvine earn $10,000 to $14,999.
3.5% of households in Irvine earn $15,000 to $24,999.
3.1% of households in Irvine earn $25,000 to $34,999.
5.2% of households in Irvine earn $35,000 to $49,999.
8.7% of households in Irvine earn $50,000 to $74,999.
8.5% of households in Irvine earn $75,000 to $99,999.
17.3% of households in Irvine earn $100,000 to $149,999.
13.6% of households in Irvine earn $150,000 to $199,999.
32.3% of households in Irvine earn $200,000 or more.
| Income | Irvine | CA | USA |
|---|---|---|---|
| Less than $10,000 | 6.0% | 4.5% | 5.0% |
| $10,000 to $14,999 | 1.7% | 2.9% | 3.4% |
| $15,000 to $24,999 | 3.5% | 5.0% | 6.3% |
| $25,000 to $34,999 | 3.1% | 5.3% | 6.6% |
| $35,000 to $49,999 | 5.2% | 8.1% | 10.1% |
| $50,000 to $74,999 | 8.7% | 13.0% | 15.5% |
| $75,000 to $99,999 | 8.5% | 11.6% | 12.6% |
| $100,000 to $149,999 | 17.3% | 17.8% | 17.5% |
| $150,000 to $199,999 | 13.6% | 11.3% | 9.6% |
| $200,000 or more | 32.3% | 20.5% | 13.4% |
Source: U.S. Census ACS 5-year estimates (2024)


