Alamosa SnackAbility
Overall SnackAbility
Crime in Alamosa summary. We use data from the FBI to determine the crime rates in Alamosa. Key points include:
There were 567 total crimes in Alamosa in the last reporting year.
The overall crime rate per 100,000 people in Alamosa is 5,723.8 / 100k people.
The violent crime rate per 100,000 people in Alamosa is 979.2 / 100k people.
The property crime rate per 100,000 people in Alamosa is 4,744.6 / 100k people.
Overall, crime in Alamosa is 170.09% above the national average.
Total Crimes
Above National Average
Crime In Alamosa Comparison Table
| Statistic | Count Raw |
Alamosa / 100k People |
Colorado / 100k People |
National / 100k People |
|---|---|---|---|---|
| Total Crimes Per 100K | 567 | 5,723.8 | 3,069.1 | 2,119.2 |
| Violent Crime | 97 | 979.2 | 476.3 | 359.0 |
| Murder | 5 | 50.5 | 4.5 | 5.0 |
| Robbery | 4 | 40.4 | 63.0 | 61.0 |
| Aggravated Assault | 70 | 706.6 | 350.5 | 256.0 |
| Property Crime | 470 | 4,744.6 | 2,592.8 | 1,760.0 |
| Burglary | 40 | 403.8 | 348.0 | 229.0 |
| Larceny | 411 | 4,149.0 | 1,754.2 | 1,272.0 |
| Car Theft | 19 | 191.8 | 490.6 | 259.0 |
Source: FBI Uniform Crime Reporting (2024)
Cost of living in Alamosa summary. We use data on the cost of living to determine how expensive it is to live in Alamosa. Real estate prices drive most of the variance in cost of living around Colorado. Key points include:
The cost of living in Alamosa is 97 with 100 being average.
The cost of living in Alamosa is 1.0x lower than the national average.
The median home value in Alamosa is $314,612.
The median income in Alamosa is $49,688.
Alamosa's Overall Cost Of Living
Lower Than The National Average
Cost Of Living In Alamosa Comparison Table
| Living Expense | Alamosa | Colorado | National Average |
|---|---|---|---|
| Overall | 97 | 114 | 100 |
| Services | 102 | 104 | 100 |
| Groceries | 104 | 107 | 100 |
| Health | 81 | 135 | 100 |
| Housing | 108 | 104 | 100 |
| Transportation | 105 | 107 | 100 |
| Utilities | 106 | 107 | 100 |
Source: Cost of living index, normalized to US average = 100
Alamosa, CO Weather
The average high in Alamosa is 59.5° and the average low is 24.6°.
There are 22.6 days of precipitation each year.
Expect an average of 7.8 inches of precipitation each year with 33.3 inches of snow.
| Stat | Alamosa |
|---|---|
| Average Annual High | 59.5 |
| Average Annual Low | 24.6 |
| Annual Precipitation Days | 22.6 |
| Average Annual Precipitation | 7.8 |
| Average Annual Snowfall | 33.3 |
Average High
Days of Rain
Source: NOAA climate normals (30-year)
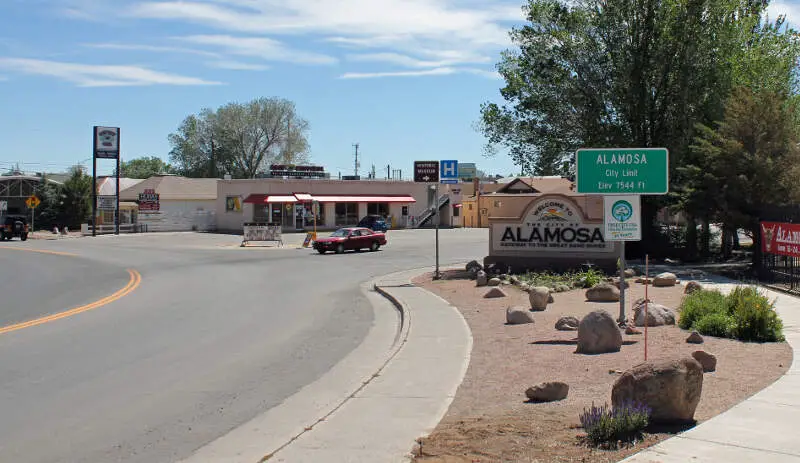
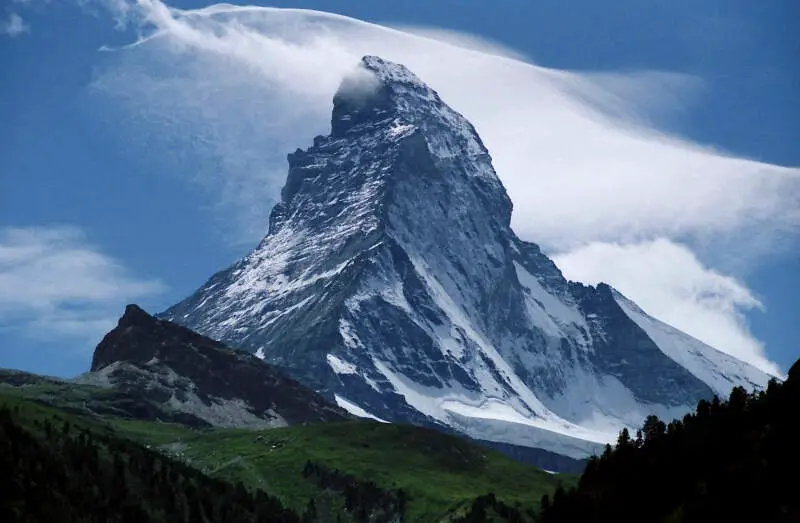
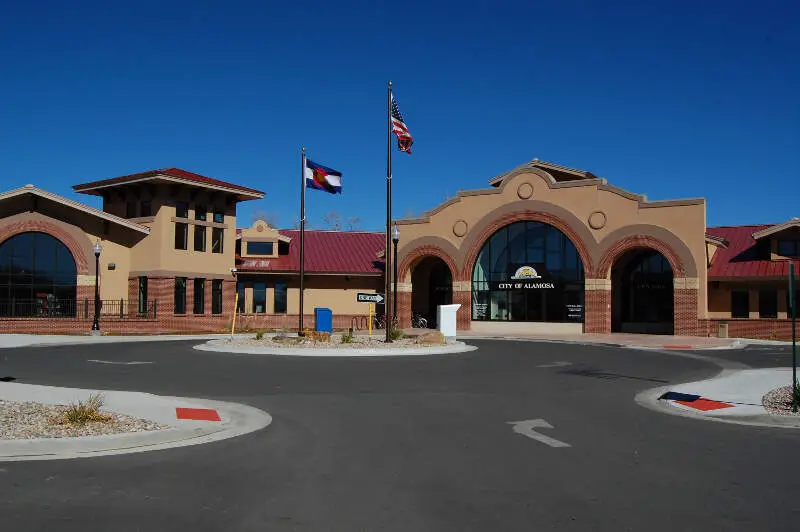
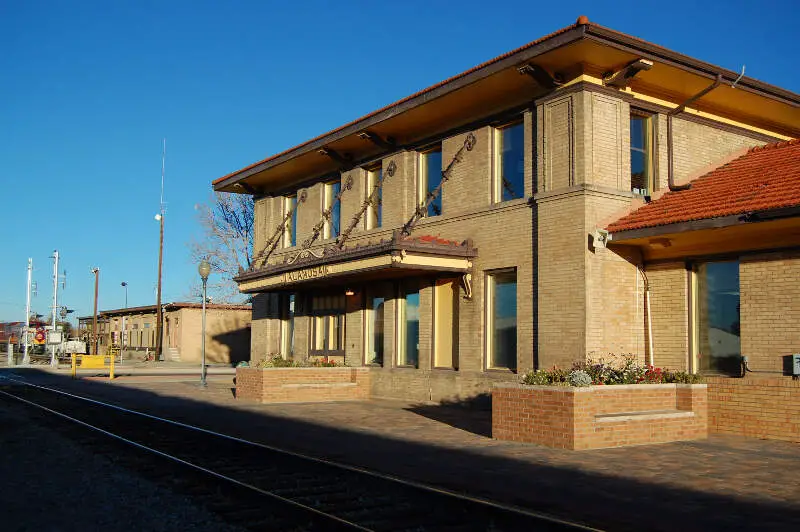
Alamosa, CO Photos
3 Reviews & Comments About Alamosa

Lmao, I lived in Alamosa for seven years, and I can say that the reason it's always sunny is because we never got any precipitation. It's a desert, and there's nothing but potatoes there.
I think it should be number one worst place to live in the State. But hey, second is pretty great too. I've lived here all 28 years, except a couple at other states for a short time. And I must say stay away from this town at all costs if you can! It's beyond horrible here. Yeah, it's absolutely breathtaking the views and mountains but the people themselves completely ruined this town. It's a hole new breed as outsiders have told me, saying they have never discovered such mean, stuck on themselves, hateful, bullying, loser jokes ever. Which I have to agree. There's no activity place to go for young children or anyone really. Very few for adults if you like golfing or disk gold. Horrible.
Mentioned it all above.
People from Alamosa and surrounding communities don't want His kind messing up a good thing. He is more than welcome to stay in the cesspool he lives in North of the Valley
Rankings & Articles For Alamosa


Locations Around Alamosa
Map Of Alamosa, CO
Best Places Around Alamosa
Alamosa Demographics And Statistics
Population over time in Alamosa
The current population in Alamosa is 9,879. The population has increased 13.6% from 2010.
| Year | Population | % Change |
|---|---|---|
| 2024 | 9,879 | 0.3% |
| 2023 | 9,847 | 0.6% |
| 2022 | 9,792 | 0.9% |
| 2021 | 9,704 | 3.7% |
| 2020 | 9,360 | -0.9% |
| 2019 | 9,441 | -3.5% |
| 2018 | 9,780 | 1.1% |
| 2017 | 9,675 | 0.0% |
| 2016 | 9,671 | 0.8% |
| 2015 | 9,592 | 1.8% |
| 2014 | 9,427 | 1.7% |
| 2013 | 9,273 | 1.9% |
| 2012 | 9,097 | 3.9% |
| 2011 | 8,752 | 0.7% |
| 2010 | 8,693 | - |
Race / Ethnicity in Alamosa
See the full breakdown
Alamosa is:
38.5% White with 3,803 White residents.
1.7% African American with 167 African American residents.
1.5% American Indian with 148 American Indian residents.
1.7% Asian with 164 Asian residents.
0.1% Hawaiian with 13 Hawaiian residents.
0.3% Other with 32 Other residents.
2.2% Two Or More with 218 Two Or More residents.
54.0% Hispanic with 5,334 Hispanic residents.
| Race | Alamosa | CO | USA |
|---|---|---|---|
| White | 38.5% | 64.8% | 57.4% |
| African American | 1.7% | 3.8% | 11.9% |
| American Indian | 1.5% | 0.4% | 0.5% |
| Asian | 1.7% | 3.2% | 5.9% |
| Hawaiian | 0.1% | 0.1% | 0.2% |
| Other | 0.3% | 0.5% | 0.6% |
| Two Or More | 2.2% | 4.6% | 4.3% |
| Hispanic | 54.0% | 22.5% | 19.3% |
Gender in Alamosa
See the full breakdown
Alamosa is 49.7% female with 4,913 female residents.
Alamosa is 50.3% male with 4,966 male residents.
| Gender | Alamosa | CO | USA |
|---|---|---|---|
| Female | 49.7% | 49.3% | 50.5% |
| Male | 50.3% | 50.7% | 49.5% |
Highest level of educational attainment in Alamosa for adults over 25
See the full breakdown
8.0% of adults in Alamosa completed < 9th grade.
3.0% of adults in Alamosa completed 9-12th grade.
23.0% of adults in Alamosa completed high school / ged.
23.0% of adults in Alamosa completed some college.
9.0% of adults in Alamosa completed associate's degree.
15.0% of adults in Alamosa completed bachelor's degree.
13.0% of adults in Alamosa completed master's degree.
3.0% of adults in Alamosa completed professional degree.
3.0% of adults in Alamosa completed doctorate degree.
| Education | Alamosa | CO | USA |
|---|---|---|---|
| < 9th Grade | 8.0% | 3.0% | 4.0% |
| 9-12th Grade | 3.0% | 4.0% | 6.0% |
| High School / GED | 23.0% | 20.0% | 26.0% |
| Some College | 23.0% | 19.0% | 19.0% |
| Associate's Degree | 9.0% | 8.0% | 9.0% |
| Bachelor's Degree | 15.0% | 28.0% | 22.0% |
| Master's Degree | 13.0% | 13.0% | 10.0% |
| Professional Degree | 3.0% | 3.0% | 2.0% |
| Doctorate Degree | 3.0% | 2.0% | 2.0% |
Household Income For Alamosa, Colorado
See the full breakdown
9.2% of households in Alamosa earn Less than $10,000.
5.2% of households in Alamosa earn $10,000 to $14,999.
14.7% of households in Alamosa earn $15,000 to $24,999.
4.5% of households in Alamosa earn $25,000 to $34,999.
17.9% of households in Alamosa earn $35,000 to $49,999.
19.9% of households in Alamosa earn $50,000 to $74,999.
9.2% of households in Alamosa earn $75,000 to $99,999.
10.2% of households in Alamosa earn $100,000 to $149,999.
7.0% of households in Alamosa earn $150,000 to $199,999.
2.2% of households in Alamosa earn $200,000 or more.
| Income | Alamosa | CO | USA |
|---|---|---|---|
| Less than $10,000 | 9.2% | 3.9% | 5.0% |
| $10,000 to $14,999 | 5.2% | 2.4% | 3.4% |
| $15,000 to $24,999 | 14.7% | 4.8% | 6.3% |
| $25,000 to $34,999 | 4.5% | 5.2% | 6.6% |
| $35,000 to $49,999 | 17.9% | 8.4% | 10.1% |
| $50,000 to $74,999 | 19.9% | 14.6% | 15.5% |
| $75,000 to $99,999 | 9.2% | 12.8% | 12.6% |
| $100,000 to $149,999 | 10.2% | 19.2% | 17.5% |
| $150,000 to $199,999 | 7.0% | 11.7% | 9.6% |
| $200,000 or more | 2.2% | 17.0% | 13.4% |
Source: U.S. Census ACS 5-year estimates (2024)


