Castle Pines, CO
Demographics And Statistics
Living In Castle Pines, Colorado Summary
Life in Castle Pines research summary. HomeSnacks has been using Saturday Night Science to research the quality of life in Castle Pines over the past nine years using Census, FBI, Zillow, and other primary data sources. Based on the most recently available data, we found the following about life in Castle Pines:
The population in Castle Pines is 12,573.
The median home value in Castle Pines is $886,849.
The median income in Castle Pines is $189,918.
The cost of living in Castle Pines is 161 which is 1.6x higher than the national average.
The median rent in Castle Pines is $2,128.
The unemployment rate in Castle Pines is 2.6%.
The poverty rate in Castle Pines is 4.7%.
The average high in Castle Pines is 63.2° and the average low is 34.3°.
Table Of Contents
Castle Pines SnackAbility
Overall SnackAbility
Castle Pines, CO Cost Of Living
Cost of living in Castle Pines summary. We use data on the cost of living to determine how expensive it is to live in Castle Pines. Real estate prices drive most of the variance in cost of living around Colorado. Key points include:
The cost of living in Castle Pines is 161 with 100 being average.
The cost of living in Castle Pines is 1.6x higher than the national average.
The median home value in Castle Pines is $886,849.
The median income in Castle Pines is $189,918.
Castle Pines's Overall Cost Of Living
Higher Than The National Average
Cost Of Living In Castle Pines Comparison Table
| Living Expense | Castle Pines | Colorado | National Average | |
|---|---|---|---|---|
| Overall | 161 | 111 | 100 | |
| Services | 108 | 102 | 100 | |
| Groceries | 103 | 103 | 100 | |
| Health | 101 | 101 | 100 | |
| Housing | 295 | 134 | 100 | |
| Transportation | 102 | 107 | 100 | |
| Utilities | 86 | 89 | 100 | |
Castle Pines, CO Weather
The average high in Castle Pines is 63.2° and the average low is 34.3°.
There are 45.1 days of precipitation each year.
Expect an average of 19.4 inches of precipitation each year with 73.6 inches of snow.
| Stat | Castle Pines |
|---|---|
| Average Annual High | 63.2 |
| Average Annual Low | 34.3 |
| Annual Precipitation Days | 45.1 |
| Average Annual Precipitation | 19.4 |
| Average Annual Snowfall | 73.6 |
Average High
Days of Rain
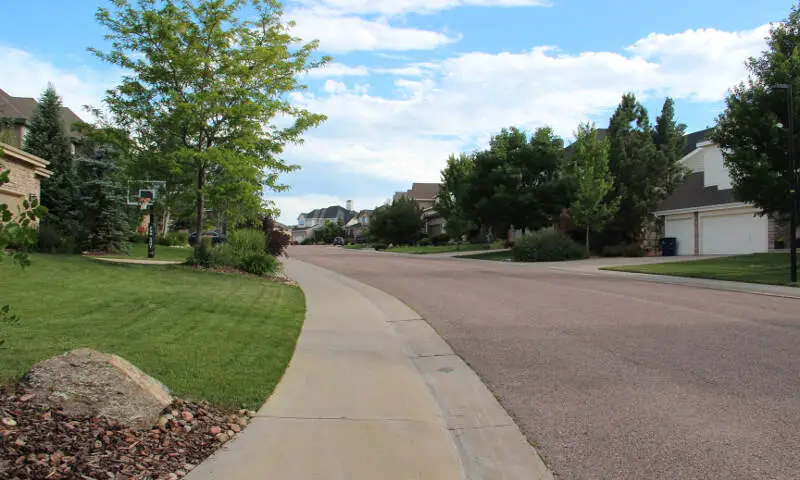
Castle Pines, CO Photos
Rankings for Castle Pines in Colorado


Locations Around Castle Pines
Map Of Castle Pines, CO
Best Places Around Castle Pines
Sheridan, CO
Population 6,031
Aurora, CO
Population 390,201
Dove Valley, CO
Population 5,313
Englewood, CO
Population 33,774
Lone Tree, CO
Population 14,136
Littleton, CO
Population 45,092
Castle Rock, CO
Population 76,614
Roxborough Park, CO
Population 9,365
Parker, CO
Population 60,115
The Pinery, CO
Population 11,740
Castle Pines Demographics And Statistics
Population over time in Castle Pines
| Year | Population | % Change |
|---|---|---|
| 2023 | 12,573 | 6.5% |
| 2022 | 11,811 | 4.6% |
| 2021 | 11,296 | 2.9% |
| 2020 | 10,977 | 3.6% |
| 2019 | 10,591 | 0.2% |
| 2018 | 10,573 | -0.5% |
| 2017 | 10,623 | 2.3% |
| 2016 | 10,389 | -0.1% |
| 2015 | 10,399 | -2.1% |
| 2014 | 10,626 | 1.5% |
| 2013 | 10,471 | 2.6% |
| 2012 | 10,210 | - |
| 2011 | 0 | - |
| 2010 | 0 | - |
Race / Ethnicity in Castle Pines
Castle Pines is:
78.2% White with 9,830 White residents.
4.1% African American with 512 African American residents.
0.1% American Indian with 16 American Indian residents.
3.2% Asian with 397 Asian residents.
0.7% Hawaiian with 83 Hawaiian residents.
0.3% Other with 32 Other residents.
3.4% Two Or More with 426 Two Or More residents.
10.2% Hispanic with 1,277 Hispanic residents.
| Race | Castle Pines | CO | USA |
|---|---|---|---|
| White | 78.2% | 65.7% | 58.2% |
| African American | 4.1% | 3.8% | 12.0% |
| American Indian | 0.1% | 0.4% | 0.5% |
| Asian | 3.2% | 3.2% | 5.7% |
| Hawaiian | 0.7% | 0.1% | 0.2% |
| Other | 0.3% | 0.4% | 0.5% |
| Two Or More | 3.4% | 4.2% | 3.9% |
| Hispanic | 10.2% | 22.2% | 19.0% |
Gender in Castle Pines
Castle Pines is 48.7% female with 6,127 female residents.
Castle Pines is 51.3% male with 6,446 male residents.
| Gender | Castle Pines | CO | USA |
|---|---|---|---|
| Female | 48.7% | 49.4% | 50.5% |
| Male | 51.3% | 50.6% | 49.5% |
Highest level of educational attainment in Castle Pines for adults over 25
-0.0% of adults in Castle Pines completed < 9th grade.
1.0% of adults in Castle Pines completed 9-12th grade.
10.0% of adults in Castle Pines completed high school / ged.
13.0% of adults in Castle Pines completed some college.
6.0% of adults in Castle Pines completed associate's degree.
45.0% of adults in Castle Pines completed bachelor's degree.
19.0% of adults in Castle Pines completed master's degree.
3.0% of adults in Castle Pines completed professional degree.
3.0% of adults in Castle Pines completed doctorate degree.
| Education | Castle Pines | CO | USA |
|---|---|---|---|
| < 9th Grade | -0.0% | 2.0% | 5.0% |
| 9-12th Grade | 1.0% | 4.0% | 6.0% |
| High School / GED | 10.0% | 20.0% | 26.0% |
| Some College | 13.0% | 20.0% | 19.0% |
| Associate's Degree | 6.0% | 8.0% | 9.0% |
| Bachelor's Degree | 45.0% | 28.0% | 21.0% |
| Master's Degree | 19.0% | 13.0% | 10.0% |
| Professional Degree | 3.0% | 3.0% | 2.0% |
| Doctorate Degree | 3.0% | 2.0% | 2.0% |
Household Income For Castle Pines, Colorado
2.0% of households in Castle Pines earn Less than $10,000.
3.3% of households in Castle Pines earn $10,000 to $14,999.
1.9% of households in Castle Pines earn $15,000 to $24,999.
1.5% of households in Castle Pines earn $25,000 to $34,999.
3.4% of households in Castle Pines earn $35,000 to $49,999.
6.6% of households in Castle Pines earn $50,000 to $74,999.
8.5% of households in Castle Pines earn $75,000 to $99,999.
13.8% of households in Castle Pines earn $100,000 to $149,999.
14.8% of households in Castle Pines earn $150,000 to $199,999.
44.2% of households in Castle Pines earn $200,000 or more.
| Income | Castle Pines | CO | USA |
|---|---|---|---|
| Less than $10,000 | 2.0% | 3.9% | 4.9% |
| $10,000 to $14,999 | 3.3% | 2.6% | 3.6% |
| $15,000 to $24,999 | 1.9% | 5.0% | 6.6% |
| $25,000 to $34,999 | 1.5% | 5.3% | 6.8% |
| $35,000 to $49,999 | 3.4% | 8.9% | 10.4% |
| $50,000 to $74,999 | 6.6% | 15.0% | 15.7% |
| $75,000 to $99,999 | 8.5% | 13.0% | 12.7% |
| $100,000 to $149,999 | 13.8% | 19.3% | 17.4% |
| $150,000 to $199,999 | 14.8% | 11.3% | 9.3% |
| $200,000 or more | 44.2% | 15.8% | 12.6% |


