Compare Estes Park to…
Estes Park SnackAbility
Overall SnackAbility
Crime in Estes Park summary. We use data from the FBI to determine the crime rates in Estes Park. Key points include:
There were 59 total crimes in Estes Park in the last reporting year.
The overall crime rate per 100,000 people in Estes Park is 1,017.4 / 100k people.
The violent crime rate per 100,000 people in Estes Park is 224.2 / 100k people.
The property crime rate per 100,000 people in Estes Park is 793.2 / 100k people.
Overall, crime in Estes Park is -51.99% below the national average.
Total Crimes
Below National Average
Crime In Estes Park Comparison Table
| Statistic | Count Raw | Estes Park / 100k People | Colorado / 100k People | National / 100k People |
|---|---|---|---|---|
| Total Crimes Per 100K | 59 | 1,017.4 | 3,069.1 | 2,119.2 |
| Violent Crime | 13 | 224.2 | 476.3 | 359.0 |
| Murder | 0 | 0.0 | 4.5 | 5.0 |
| Robbery | 2 | 34.5 | 63.0 | 61.0 |
| Aggravated Assault | 10 | 172.4 | 350.5 | 256.0 |
| Property Crime | 46 | 793.2 | 2,592.8 | 1,760.0 |
| Burglary | 4 | 69.0 | 348.0 | 229.0 |
| Larceny | 36 | 620.8 | 1,754.2 | 1,272.0 |
| Car Theft | 6 | 103.5 | 490.6 | 259.0 |
Source: FBI Uniform Crime Reporting (2024)
Cost of living in Estes Park summary. We use data on the cost of living to determine how expensive it is to live in Estes Park. Real estate prices drive most of the variance in cost of living around Colorado. Key points include:
The cost of living in Estes Park is 133 with 100 being average.
The cost of living in Estes Park is 1.3x higher than the national average.
The median home value in Estes Park is $684,046.
The median income in Estes Park is $85,956.
Estes Park's Overall Cost Of Living
Higher Than The National Average
Cost Of Living In Estes Park Comparison Table
| Living Expense | Estes Park | Colorado | National Average |
|---|---|---|---|
| Overall | 133 | 114 | 100 |
| Services | 109 | 104 | 100 |
| Groceries | 108 | 107 | 100 |
| Health | 198 | 135 | 100 |
| Housing | 105 | 104 | 100 |
| Transportation | 107 | 107 | 100 |
| Utilities | 107 | 107 | 100 |
Source: Cost of living index, normalized to US average = 100
Estes Park, CO Weather
The average high in Estes Park is 60.4° and the average low is 32.9°.
There are 40.0 days of precipitation each year.
Expect an average of 16.7 inches of precipitation each year with 71.2 inches of snow.
| Stat | Estes Park |
|---|---|
| Average Annual High | 60.4 |
| Average Annual Low | 32.9 |
| Annual Precipitation Days | 40.0 |
| Average Annual Precipitation | 16.7 |
| Average Annual Snowfall | 71.2 |
Average High
Days of Rain
Source: NOAA climate normals (30-year)
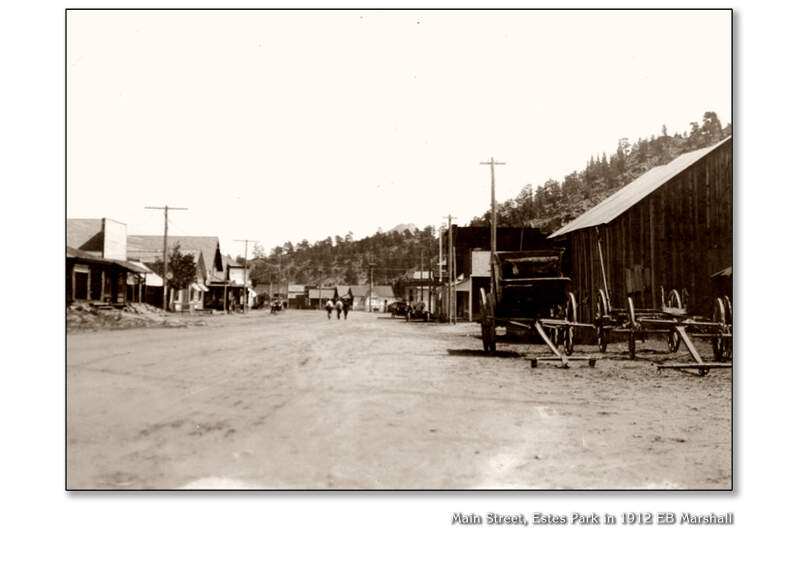
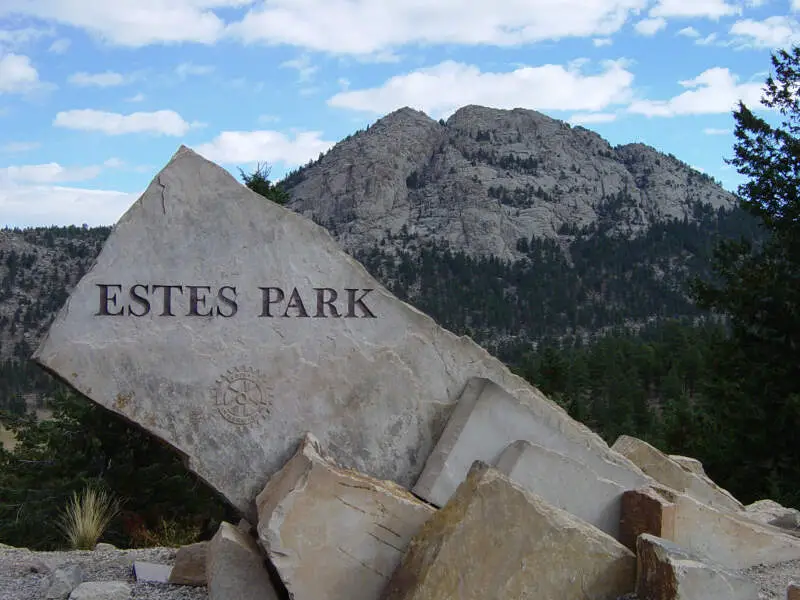
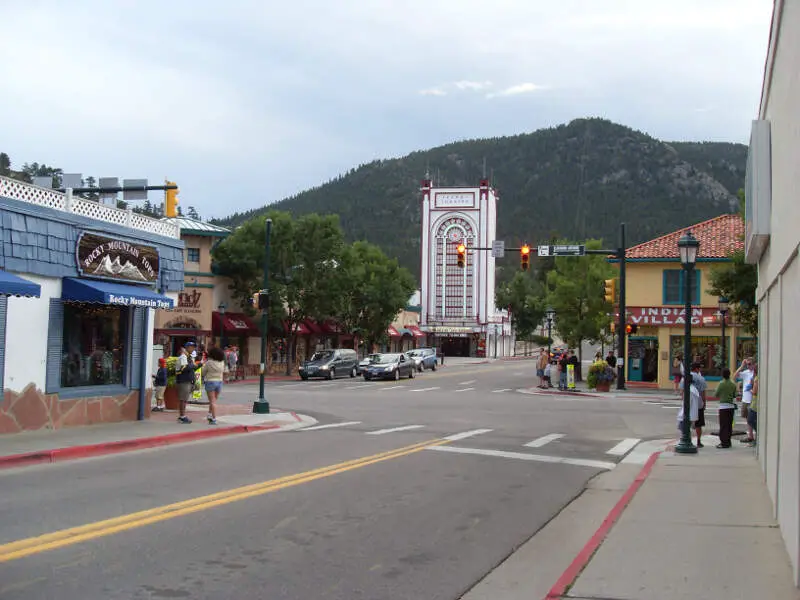
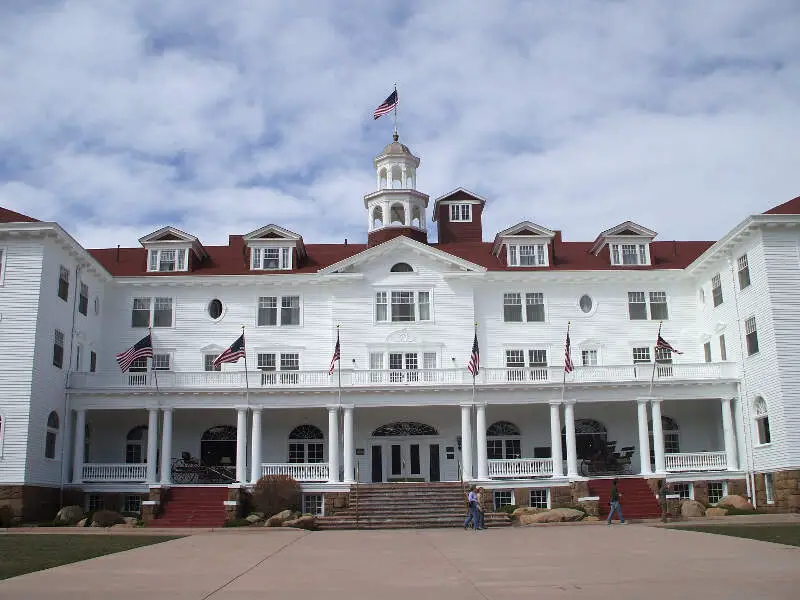
Estes Park, CO Photos

Rankings & Articles For Estes Park


Locations Around Estes Park
Map Of Estes Park, CO
Best Places Around Estes Park
Greeley, CO
Population 110,806
Federal Heights, CO
Population 14,125
Fort Lupton, CO
Population 8,897
Berkley, CO
Population 10,789
Welby, CO
Population 16,197
Sherrelwood, CO
Population 18,692
Evans, CO
Population 22,396
Firestone, CO
Population 18,049
Brighton, CO
Population 42,059
Wheat Ridge, CO
Population 32,070
Estes Park Demographics And Statistics
Population over time in Estes Park
The current population in Estes Park is 5,844. The population has increased 0.4% from 2010.
| Year | Population | % Change |
|---|---|---|
| 2024 | 5,844 | -0.6% |
| 2023 | 5,879 | -0.5% |
| 2022 | 5,906 | -0.6% |
| 2021 | 5,942 | -8.6% |
| 2020 | 6,504 | 2.0% |
| 2019 | 6,377 | 1.3% |
| 2018 | 6,297 | 0.8% |
| 2017 | 6,248 | 0.3% |
| 2016 | 6,230 | 2.1% |
| 2015 | 6,103 | 1.3% |
| 2014 | 6,022 | 0.9% |
| 2013 | 5,969 | 1.2% |
| 2012 | 5,901 | 0.6% |
| 2011 | 5,863 | 0.7% |
| 2010 | 5,820 | - |
Race / Ethnicity in Estes Park
See the full breakdown
Estes Park is:
88.6% White with 5,179 White residents.
0.2% African American with 9 African American residents.
0.4% American Indian with 26 American Indian residents.
2.8% Asian with 163 Asian residents.
0.0% Hawaiian with 0 Hawaiian residents.
0.6% Other with 36 Other residents.
1.2% Two Or More with 72 Two Or More residents.
6.1% Hispanic with 359 Hispanic residents.
| Race | Estes Park | CO | USA |
|---|---|---|---|
| White | 88.6% | 64.8% | 57.4% |
| African American | 0.2% | 3.8% | 11.9% |
| American Indian | 0.4% | 0.4% | 0.5% |
| Asian | 2.8% | 3.2% | 5.9% |
| Hawaiian | 0.0% | 0.1% | 0.2% |
| Other | 0.6% | 0.5% | 0.6% |
| Two Or More | 1.2% | 4.6% | 4.3% |
| Hispanic | 6.1% | 22.5% | 19.3% |
Gender in Estes Park
See the full breakdown
Estes Park is 54.1% female with 3,164 female residents.
Estes Park is 45.9% male with 2,679 male residents.
| Gender | Estes Park | CO | USA |
|---|---|---|---|
| Female | 54.1% | 49.3% | 50.5% |
| Male | 45.9% | 50.7% | 49.5% |
Highest level of educational attainment in Estes Park for adults over 25
See the full breakdown
-1.0% of adults in Estes Park completed < 9th grade.
2.0% of adults in Estes Park completed 9-12th grade.
15.0% of adults in Estes Park completed high school / ged.
18.0% of adults in Estes Park completed some college.
8.0% of adults in Estes Park completed associate's degree.
34.0% of adults in Estes Park completed bachelor's degree.
16.0% of adults in Estes Park completed master's degree.
4.0% of adults in Estes Park completed professional degree.
4.0% of adults in Estes Park completed doctorate degree.
| Education | Estes Park | CO | USA |
|---|---|---|---|
| < 9th Grade | -1.0% | 3.0% | 4.0% |
| 9-12th Grade | 2.0% | 4.0% | 6.0% |
| High School / GED | 15.0% | 20.0% | 26.0% |
| Some College | 18.0% | 19.0% | 19.0% |
| Associate's Degree | 8.0% | 8.0% | 9.0% |
| Bachelor's Degree | 34.0% | 28.0% | 22.0% |
| Master's Degree | 16.0% | 13.0% | 10.0% |
| Professional Degree | 4.0% | 3.0% | 2.0% |
| Doctorate Degree | 4.0% | 2.0% | 2.0% |
Household Income For Estes Park, Colorado
See the full breakdown
4.6% of households in Estes Park earn Less than $10,000.
1.6% of households in Estes Park earn $10,000 to $14,999.
4.9% of households in Estes Park earn $15,000 to $24,999.
4.0% of households in Estes Park earn $25,000 to $34,999.
11.0% of households in Estes Park earn $35,000 to $49,999.
19.1% of households in Estes Park earn $50,000 to $74,999.
12.6% of households in Estes Park earn $75,000 to $99,999.
18.5% of households in Estes Park earn $100,000 to $149,999.
6.5% of households in Estes Park earn $150,000 to $199,999.
17.1% of households in Estes Park earn $200,000 or more.
| Income | Estes Park | CO | USA |
|---|---|---|---|
| Less than $10,000 | 4.6% | 3.9% | 5.0% |
| $10,000 to $14,999 | 1.6% | 2.4% | 3.4% |
| $15,000 to $24,999 | 4.9% | 4.8% | 6.3% |
| $25,000 to $34,999 | 4.0% | 5.2% | 6.6% |
| $35,000 to $49,999 | 11.0% | 8.4% | 10.1% |
| $50,000 to $74,999 | 19.1% | 14.6% | 15.5% |
| $75,000 to $99,999 | 12.6% | 12.8% | 12.6% |
| $100,000 to $149,999 | 18.5% | 19.2% | 17.5% |
| $150,000 to $199,999 | 6.5% | 11.7% | 9.6% |
| $200,000 or more | 17.1% | 17.0% | 13.4% |
Source: U.S. Census ACS 5-year estimates (2024)


