Grand Junction SnackAbility
Overall SnackAbility
Crime in Grand Junction summary. We use data from the FBI to determine the crime rates in Grand Junction. Key points include:
There were 2,627 total crimes in Grand Junction in the last reporting year.
The overall crime rate per 100,000 people in Grand Junction is 3,716.4 / 100k people.
The violent crime rate per 100,000 people in Grand Junction is 546.1 / 100k people.
The property crime rate per 100,000 people in Grand Junction is 3,170.4 / 100k people.
Overall, crime in Grand Junction is 75.37% above the national average.
Total Crimes
Above National Average
Crime In Grand Junction Comparison Table
| Statistic | Count Raw |
Grand Junction / 100k People |
Colorado / 100k People |
National / 100k People |
|---|---|---|---|---|
| Total Crimes Per 100K | 2,627 | 3,716.4 | 3,069.1 | 2,119.2 |
| Violent Crime | 386 | 546.1 | 476.3 | 359.0 |
| Murder | 3 | 4.2 | 4.5 | 5.0 |
| Robbery | 34 | 48.1 | 63.0 | 61.0 |
| Aggravated Assault | 290 | 410.3 | 350.5 | 256.0 |
| Property Crime | 2,241 | 3,170.4 | 2,592.8 | 1,760.0 |
| Burglary | 227 | 321.1 | 348.0 | 229.0 |
| Larceny | 1,855 | 2,624.3 | 1,754.2 | 1,272.0 |
| Car Theft | 159 | 224.9 | 490.6 | 259.0 |
Source: FBI Uniform Crime Reporting (2024)
Cost of living in Grand Junction summary. We use data on the cost of living to determine how expensive it is to live in Grand Junction. Real estate prices drive most of the variance in cost of living around Colorado. Key points include:
The cost of living in Grand Junction is 114 with 100 being average.
The cost of living in Grand Junction is 1.1x higher than the national average.
The median home value in Grand Junction is $422,319.
The median income in Grand Junction is $70,080.
Grand Junction's Overall Cost Of Living
Higher Than The National Average
Cost Of Living In Grand Junction Comparison Table
| Living Expense | Grand Junction | Colorado | National Average |
|---|---|---|---|
| Overall | 114 | 114 | 100 |
| Services | 104 | 104 | 100 |
| Groceries | 107 | 107 | 100 |
| Health | 125 | 135 | 100 |
| Housing | 107 | 104 | 100 |
| Transportation | 111 | 107 | 100 |
| Utilities | 111 | 107 | 100 |
Source: Cost of living index, normalized to US average = 100
Grand Junction, CO Weather
The average high in Grand Junction is 65.7° and the average low is 37.7°.
There are 36.0 days of precipitation each year.
Expect an average of 11.2 inches of precipitation each year with 21.3 inches of snow.
| Stat | Grand Junction |
|---|---|
| Average Annual High | 65.7 |
| Average Annual Low | 37.7 |
| Annual Precipitation Days | 36.0 |
| Average Annual Precipitation | 11.2 |
| Average Annual Snowfall | 21.3 |
Average High
Days of Rain
Source: NOAA climate normals (30-year)
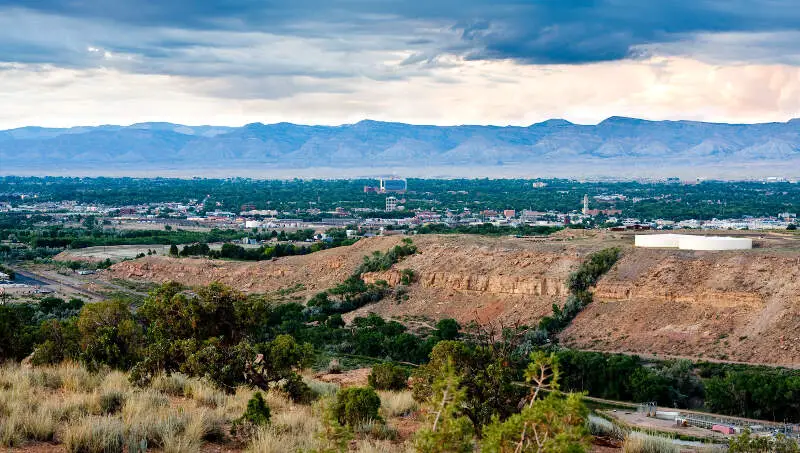
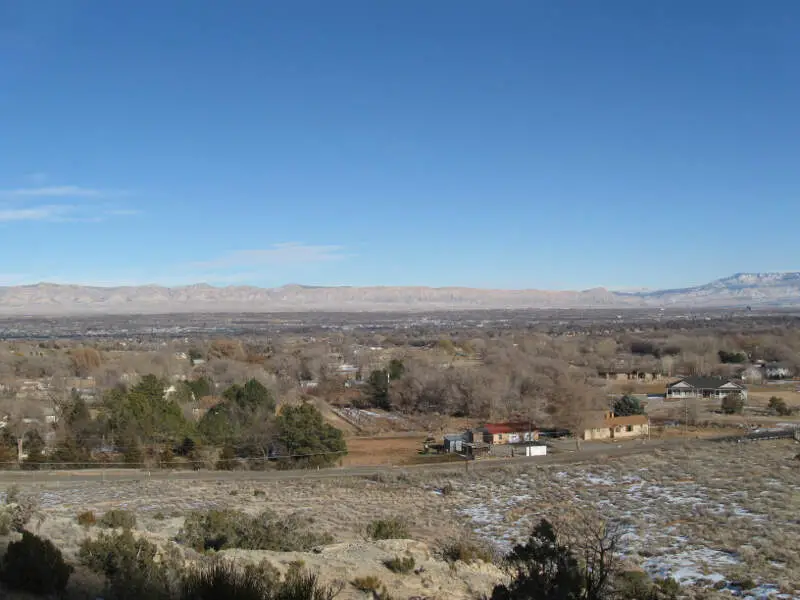
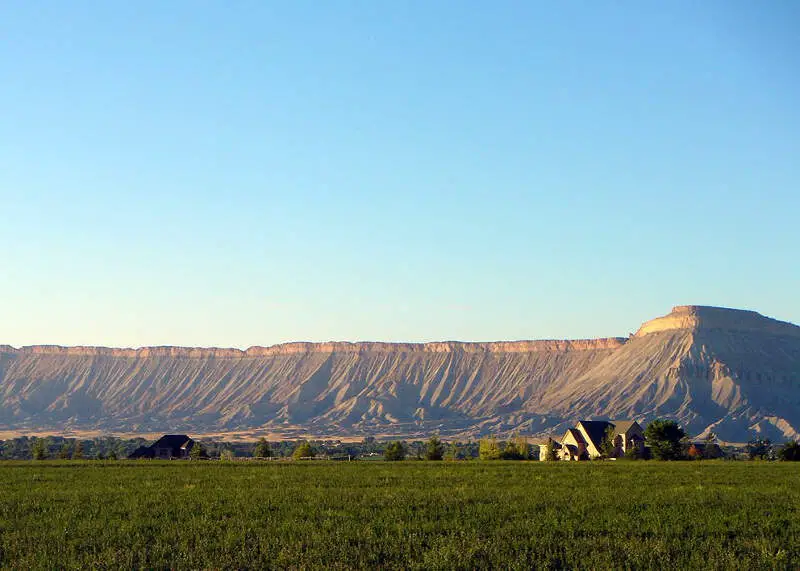
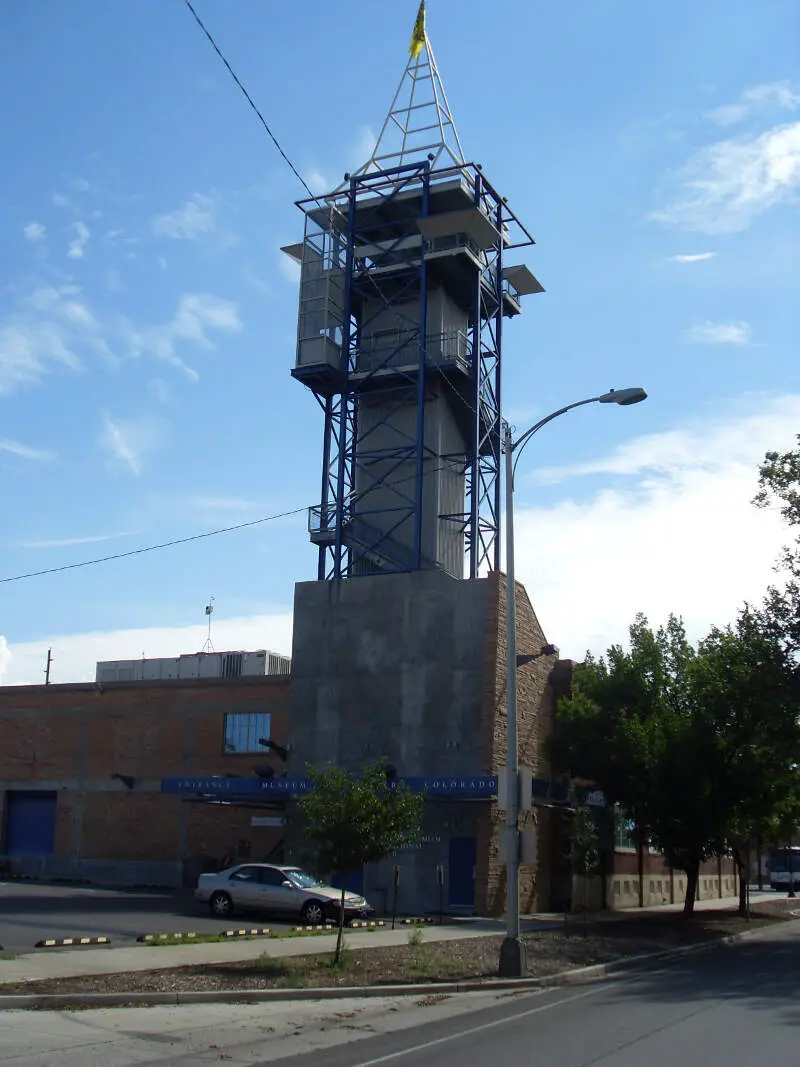
Grand Junction, CO Photos
6 Reviews & Comments About Grand Junction

I live in colorado and the city grand junction is nice,fun,and pretty,the weather is so unpredictable might be sunny one gour and a ice storm the next hour,then the next day there is a thunderstorm
Dude I love grand junction and pagosa I live in pagosa r****d
I live in grand junction its not that bad but still s***s
I live in Aurora and he is telling the truth it s***s
I live in Grand Junction ! there's a lot of druggies here
lololol I live in grand junction and my mom claims it's great
Rankings & Articles For Grand Junction


Locations Around Grand Junction
Map Of Grand Junction, CO
Best Places Around Grand Junction
Redlands, CO
Population 8,868
Orchard Mesa, CO
Population 6,945
Fruita, CO
Population 13,691
Clifton, CO
Population 19,518
Fruitvale, CO
Population 8,019
Grand Junction Demographics And Statistics
Population over time in Grand Junction
The current population in Grand Junction is 68,142. The population has increased 21.0% from 2010.
| Year | Population | % Change |
|---|---|---|
| 2024 | 68,142 | 1.7% |
| 2023 | 67,027 | 1.7% |
| 2022 | 65,918 | 1.3% |
| 2021 | 65,067 | 4.6% |
| 2020 | 62,218 | 0.3% |
| 2019 | 62,062 | 0.9% |
| 2018 | 61,479 | 1.0% |
| 2017 | 60,882 | 0.4% |
| 2016 | 60,630 | 1.1% |
| 2015 | 59,945 | 0.4% |
| 2014 | 59,731 | 0.5% |
| 2013 | 59,442 | 1.0% |
| 2012 | 58,867 | 2.4% |
| 2011 | 57,479 | 2.1% |
| 2010 | 56,295 | - |
Race / Ethnicity in Grand Junction
See the full breakdown
Grand Junction is:
76.0% White with 51,776 White residents.
0.8% African American with 521 African American residents.
0.4% American Indian with 288 American Indian residents.
1.0% Asian with 688 Asian residents.
0.1% Hawaiian with 68 Hawaiian residents.
0.7% Other with 492 Other residents.
4.0% Two Or More with 2,728 Two Or More residents.
17.0% Hispanic with 11,581 Hispanic residents.
| Race | Grand Junction | CO | USA |
|---|---|---|---|
| White | 76.0% | 64.8% | 57.4% |
| African American | 0.8% | 3.8% | 11.9% |
| American Indian | 0.4% | 0.4% | 0.5% |
| Asian | 1.0% | 3.2% | 5.9% |
| Hawaiian | 0.1% | 0.1% | 0.2% |
| Other | 0.7% | 0.5% | 0.6% |
| Two Or More | 4.0% | 4.6% | 4.3% |
| Hispanic | 17.0% | 22.5% | 19.3% |
Gender in Grand Junction
See the full breakdown
Grand Junction is 49.8% female with 33,954 female residents.
Grand Junction is 50.2% male with 34,187 male residents.
| Gender | Grand Junction | CO | USA |
|---|---|---|---|
| Female | 49.8% | 49.3% | 50.5% |
| Male | 50.2% | 50.7% | 49.5% |
Highest level of educational attainment in Grand Junction for adults over 25
See the full breakdown
2.0% of adults in Grand Junction completed < 9th grade.
5.0% of adults in Grand Junction completed 9-12th grade.
24.0% of adults in Grand Junction completed high school / ged.
23.0% of adults in Grand Junction completed some college.
9.0% of adults in Grand Junction completed associate's degree.
25.0% of adults in Grand Junction completed bachelor's degree.
9.0% of adults in Grand Junction completed master's degree.
2.0% of adults in Grand Junction completed professional degree.
1.0% of adults in Grand Junction completed doctorate degree.
| Education | Grand Junction | CO | USA |
|---|---|---|---|
| < 9th Grade | 2.0% | 3.0% | 4.0% |
| 9-12th Grade | 5.0% | 4.0% | 6.0% |
| High School / GED | 24.0% | 20.0% | 26.0% |
| Some College | 23.0% | 19.0% | 19.0% |
| Associate's Degree | 9.0% | 8.0% | 9.0% |
| Bachelor's Degree | 25.0% | 28.0% | 22.0% |
| Master's Degree | 9.0% | 13.0% | 10.0% |
| Professional Degree | 2.0% | 3.0% | 2.0% |
| Doctorate Degree | 1.0% | 2.0% | 2.0% |
Household Income For Grand Junction, Colorado
See the full breakdown
5.5% of households in Grand Junction earn Less than $10,000.
3.9% of households in Grand Junction earn $10,000 to $14,999.
7.0% of households in Grand Junction earn $15,000 to $24,999.
8.1% of households in Grand Junction earn $25,000 to $34,999.
10.1% of households in Grand Junction earn $35,000 to $49,999.
18.4% of households in Grand Junction earn $50,000 to $74,999.
13.1% of households in Grand Junction earn $75,000 to $99,999.
17.9% of households in Grand Junction earn $100,000 to $149,999.
8.3% of households in Grand Junction earn $150,000 to $199,999.
7.7% of households in Grand Junction earn $200,000 or more.
| Income | Grand Junction | CO | USA |
|---|---|---|---|
| Less than $10,000 | 5.5% | 3.9% | 5.0% |
| $10,000 to $14,999 | 3.9% | 2.4% | 3.4% |
| $15,000 to $24,999 | 7.0% | 4.8% | 6.3% |
| $25,000 to $34,999 | 8.1% | 5.2% | 6.6% |
| $35,000 to $49,999 | 10.1% | 8.4% | 10.1% |
| $50,000 to $74,999 | 18.4% | 14.6% | 15.5% |
| $75,000 to $99,999 | 13.1% | 12.8% | 12.6% |
| $100,000 to $149,999 | 17.9% | 19.2% | 17.5% |
| $150,000 to $199,999 | 8.3% | 11.7% | 9.6% |
| $200,000 or more | 7.7% | 17.0% | 13.4% |
Source: U.S. Census ACS 5-year estimates (2024)


