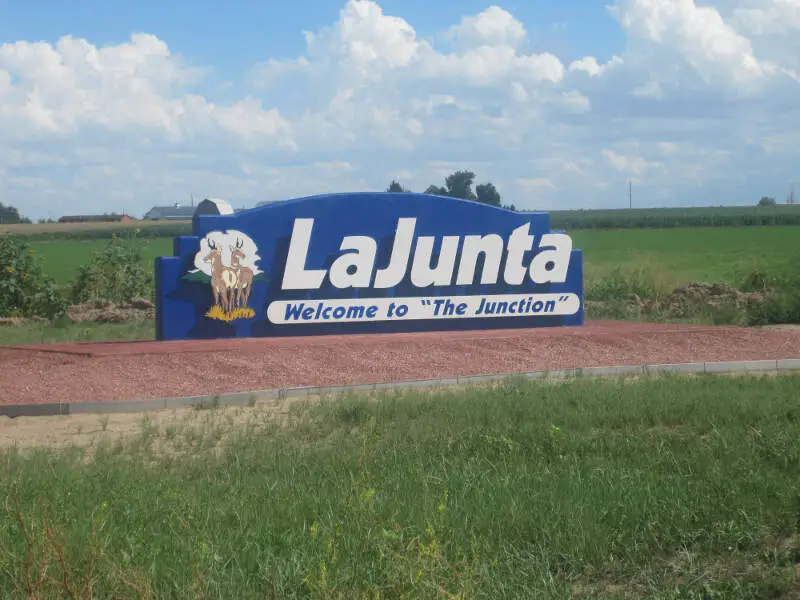
La Junta SnackAbility
Overall SnackAbility
Crime in La Junta summary. We use data from the FBI to determine the crime rates in La Junta. Key points include:
There were 521 total crimes in La Junta in the last reporting year.
The overall crime rate per 100,000 people in La Junta is 7,505.0 / 100k people.
The violent crime rate per 100,000 people in La Junta is 504.2 / 100k people.
The property crime rate per 100,000 people in La Junta is 7,000.9 / 100k people.
Overall, crime in La Junta is 254.14% above the national average.
Total Crimes
Above National Average
Crime In La Junta Comparison Table
| Statistic | Count Raw |
La Junta / 100k People |
Colorado / 100k People |
National / 100k People |
|---|---|---|---|---|
| Total Crimes Per 100K | 521 | 7,505.0 | 3,069.1 | 2,119.2 |
| Violent Crime | 35 | 504.2 | 476.3 | 359.0 |
| Murder | 1 | 14.4 | 4.5 | 5.0 |
| Robbery | 1 | 14.4 | 63.0 | 61.0 |
| Aggravated Assault | 26 | 374.5 | 350.5 | 256.0 |
| Property Crime | 486 | 7,000.9 | 2,592.8 | 1,760.0 |
| Burglary | 73 | 1,051.6 | 348.0 | 229.0 |
| Larceny | 389 | 5,603.6 | 1,754.2 | 1,272.0 |
| Car Theft | 24 | 345.7 | 490.6 | 259.0 |
Source: FBI Uniform Crime Reporting (2024)
Cost of living in La Junta summary. We use data on the cost of living to determine how expensive it is to live in La Junta. Real estate prices drive most of the variance in cost of living around Colorado. Key points include:
The cost of living in La Junta is 91 with 100 being average.
The cost of living in La Junta is 0.9x lower than the national average.
The median home value in La Junta is $158,562.
The median income in La Junta is $52,315.
La Junta's Overall Cost Of Living
Lower Than The National Average
Cost Of Living In La Junta Comparison Table
| Living Expense | La Junta | Colorado | National Average |
|---|---|---|---|
| Overall | 91 | 114 | 100 |
| Services | 106 | 104 | 100 |
| Groceries | 106 | 107 | 100 |
| Health | 54 | 135 | 100 |
| Housing | 103 | 104 | 100 |
| Transportation | 110 | 107 | 100 |
| Utilities | 114 | 107 | 100 |
Source: Cost of living index, normalized to US average = 100
La Junta, CO Weather
The average high in La Junta is 69.5° and the average low is 37.0°.
There are 30.5 days of precipitation each year.
Expect an average of 12.3 inches of precipitation each year with 25.7 inches of snow.
| Stat | La Junta |
|---|---|
| Average Annual High | 69.5 |
| Average Annual Low | 37.0 |
| Annual Precipitation Days | 30.5 |
| Average Annual Precipitation | 12.3 |
| Average Annual Snowfall | 25.7 |
Average High
Days of Rain
Source: NOAA climate normals (30-year)
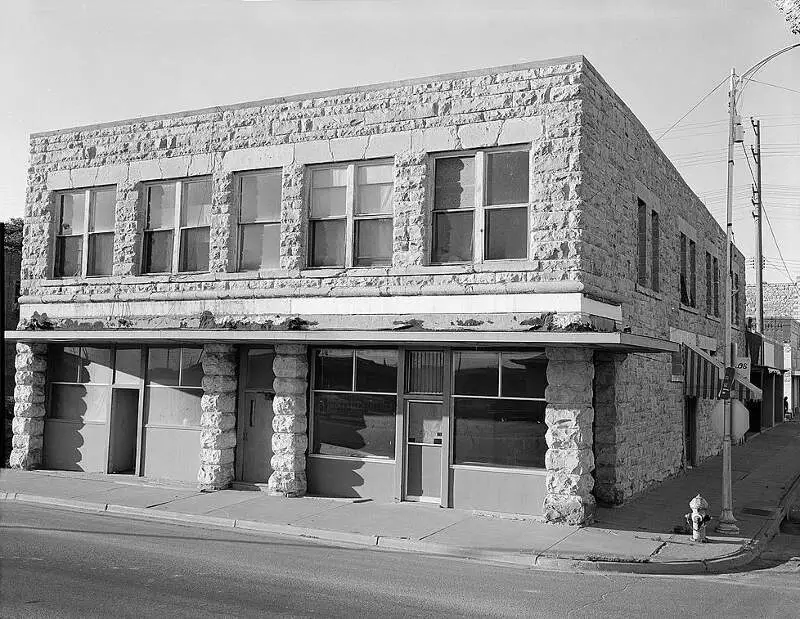
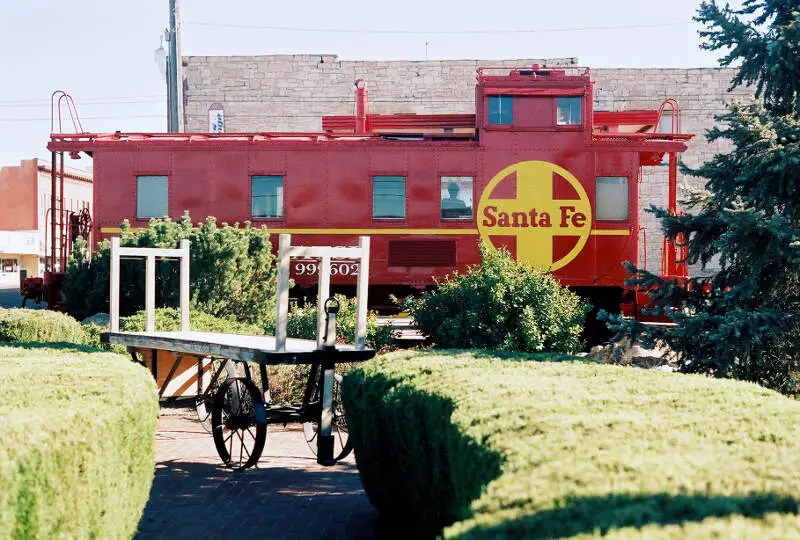
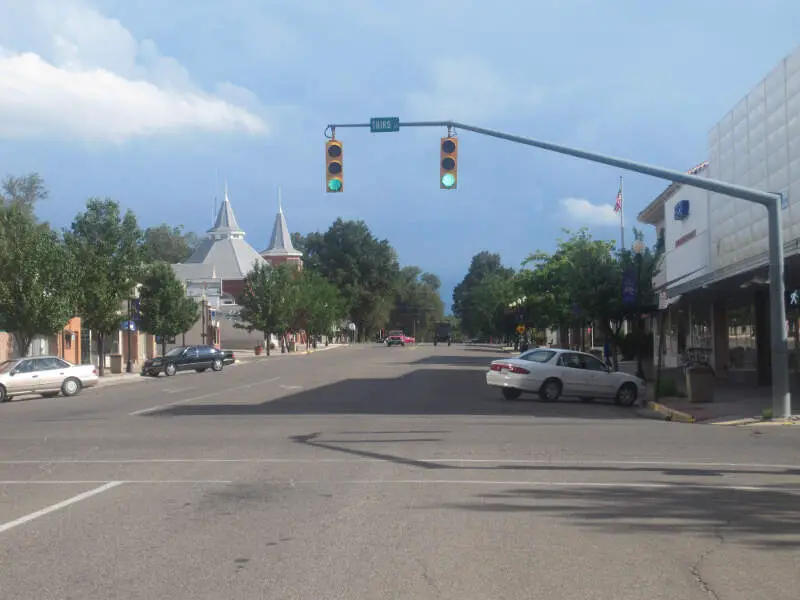
La Junta, CO Photos
1 Reviews & Comments About La Junta

This is a small town with not a whole lot to do but the crime rate is low and the schools are amazing. The people are kind and giving and smiling and its just an all around good place to be. It is clean and the cost of living is affordable. it is an hour away from the bigger cities and shopping areas
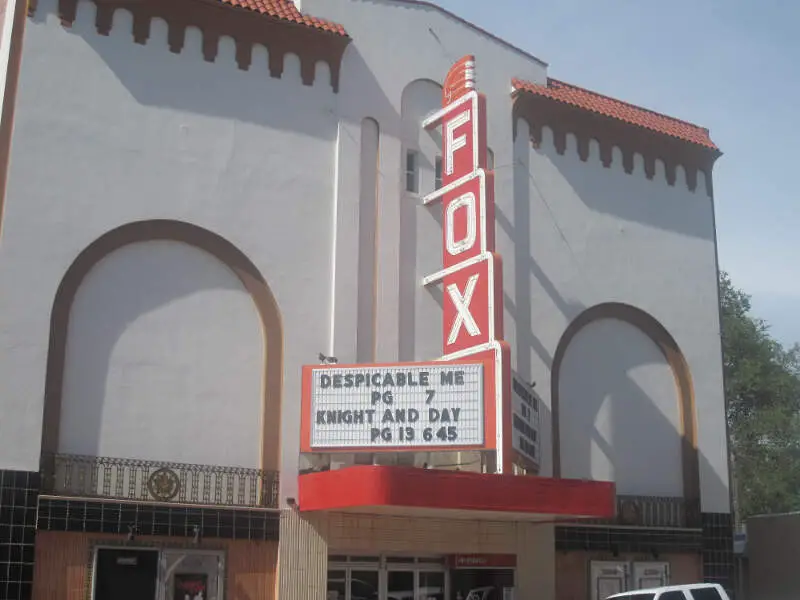
FOX theater has been around for a really long time offering 2 movie screens to enjoy buttered popcorn and snacks in front of.
The Wipeout swimming pool has 2 slides and offers hot dogs and burgers slushies nachos and other great treats
Rankings & Articles For La Junta


Locations Around La Junta
Map Of La Junta, CO
Best Places Around La Junta
La Junta Demographics And Statistics
Population over time in La Junta
The current population in La Junta is 7,140. The population has increased 1.1% from 2010.
| Year | Population | % Change |
|---|---|---|
| 2024 | 7,140 | -1.0% |
| 2023 | 7,211 | -0.5% |
| 2022 | 7,244 | -0.5% |
| 2021 | 7,282 | 5.4% |
| 2020 | 6,907 | 0.2% |
| 2019 | 6,893 | -0.3% |
| 2018 | 6,914 | 0.2% |
| 2017 | 6,900 | -1.1% |
| 2016 | 6,978 | -0.6% |
| 2015 | 7,018 | -0.3% |
| 2014 | 7,040 | -0.9% |
| 2013 | 7,106 | 0.7% |
| 2012 | 7,060 | 0.2% |
| 2011 | 7,047 | -0.2% |
| 2010 | 7,063 | - |
Race / Ethnicity in La Junta
See the full breakdown
La Junta is:
52.6% White with 3,753 White residents.
1.3% African American with 95 African American residents.
0.6% American Indian with 41 American Indian residents.
0.2% Asian with 15 Asian residents.
0.0% Hawaiian with 0 Hawaiian residents.
0.0% Other with 0 Other residents.
2.6% Two Or More with 188 Two Or More residents.
42.7% Hispanic with 3,048 Hispanic residents.
| Race | La Junta | CO | USA |
|---|---|---|---|
| White | 52.6% | 64.8% | 57.4% |
| African American | 1.3% | 3.8% | 11.9% |
| American Indian | 0.6% | 0.4% | 0.5% |
| Asian | 0.2% | 3.2% | 5.9% |
| Hawaiian | 0.0% | 0.1% | 0.2% |
| Other | 0.0% | 0.5% | 0.6% |
| Two Or More | 2.6% | 4.6% | 4.3% |
| Hispanic | 42.7% | 22.5% | 19.3% |
Gender in La Junta
See the full breakdown
La Junta is 50.5% female with 3,605 female residents.
La Junta is 49.5% male with 3,535 male residents.
| Gender | La Junta | CO | USA |
|---|---|---|---|
| Female | 50.5% | 49.3% | 50.5% |
| Male | 49.5% | 50.7% | 49.5% |
Highest level of educational attainment in La Junta for adults over 25
See the full breakdown
6.0% of adults in La Junta completed < 9th grade.
11.0% of adults in La Junta completed 9-12th grade.
25.0% of adults in La Junta completed high school / ged.
25.0% of adults in La Junta completed some college.
15.0% of adults in La Junta completed associate's degree.
9.0% of adults in La Junta completed bachelor's degree.
7.0% of adults in La Junta completed master's degree.
2.0% of adults in La Junta completed professional degree.
0.0% of adults in La Junta completed doctorate degree.
| Education | La Junta | CO | USA |
|---|---|---|---|
| < 9th Grade | 6.0% | 3.0% | 4.0% |
| 9-12th Grade | 11.0% | 4.0% | 6.0% |
| High School / GED | 25.0% | 20.0% | 26.0% |
| Some College | 25.0% | 19.0% | 19.0% |
| Associate's Degree | 15.0% | 8.0% | 9.0% |
| Bachelor's Degree | 9.0% | 28.0% | 22.0% |
| Master's Degree | 7.0% | 13.0% | 10.0% |
| Professional Degree | 2.0% | 3.0% | 2.0% |
| Doctorate Degree | 0.0% | 2.0% | 2.0% |
Household Income For La Junta, Colorado
See the full breakdown
5.1% of households in La Junta earn Less than $10,000.
6.8% of households in La Junta earn $10,000 to $14,999.
9.7% of households in La Junta earn $15,000 to $24,999.
11.5% of households in La Junta earn $25,000 to $34,999.
13.6% of households in La Junta earn $35,000 to $49,999.
14.3% of households in La Junta earn $50,000 to $74,999.
14.5% of households in La Junta earn $75,000 to $99,999.
20.1% of households in La Junta earn $100,000 to $149,999.
2.4% of households in La Junta earn $150,000 to $199,999.
2.0% of households in La Junta earn $200,000 or more.
| Income | La Junta | CO | USA |
|---|---|---|---|
| Less than $10,000 | 5.1% | 3.9% | 5.0% |
| $10,000 to $14,999 | 6.8% | 2.4% | 3.4% |
| $15,000 to $24,999 | 9.7% | 4.8% | 6.3% |
| $25,000 to $34,999 | 11.5% | 5.2% | 6.6% |
| $35,000 to $49,999 | 13.6% | 8.4% | 10.1% |
| $50,000 to $74,999 | 14.3% | 14.6% | 15.5% |
| $75,000 to $99,999 | 14.5% | 12.8% | 12.6% |
| $100,000 to $149,999 | 20.1% | 19.2% | 17.5% |
| $150,000 to $199,999 | 2.4% | 11.7% | 9.6% |
| $200,000 or more | 2.0% | 17.0% | 13.4% |
Source: U.S. Census ACS 5-year estimates (2024)


