Trinidad SnackAbility
Overall SnackAbility
Crime in Trinidad summary. We use data from the FBI to determine the crime rates in Trinidad. Key points include:
There were 306 total crimes in Trinidad in the last reporting year.
The overall crime rate per 100,000 people in Trinidad is 3,742.7 / 100k people.
The violent crime rate per 100,000 people in Trinidad is 770.5 / 100k people.
The property crime rate per 100,000 people in Trinidad is 2,972.1 / 100k people.
Overall, crime in Trinidad is 76.60% above the national average.
Total Crimes
Above National Average
Crime In Trinidad Comparison Table
| Statistic | Count Raw |
Trinidad / 100k People |
Colorado / 100k People |
National / 100k People |
|---|---|---|---|---|
| Total Crimes Per 100K | 306 | 3,742.7 | 3,069.1 | 2,119.2 |
| Violent Crime | 63 | 770.5 | 476.3 | 359.0 |
| Murder | 0 | 0.0 | 4.5 | 5.0 |
| Robbery | 2 | 24.5 | 63.0 | 61.0 |
| Aggravated Assault | 59 | 721.6 | 350.5 | 256.0 |
| Property Crime | 243 | 2,972.1 | 2,592.8 | 1,760.0 |
| Burglary | 66 | 807.2 | 348.0 | 229.0 |
| Larceny | 158 | 1,932.5 | 1,754.2 | 1,272.0 |
| Car Theft | 19 | 232.4 | 490.6 | 259.0 |
Source: FBI Uniform Crime Reporting (2024)
Cost of living in Trinidad summary. We use data on the cost of living to determine how expensive it is to live in Trinidad. Real estate prices drive most of the variance in cost of living around Colorado. Key points include:
The cost of living in Trinidad is 96 with 100 being average.
The cost of living in Trinidad is 1.0x lower than the national average.
The median home value in Trinidad is $230,017.
The median income in Trinidad is $52,273.
Trinidad's Overall Cost Of Living
Lower Than The National Average
Cost Of Living In Trinidad Comparison Table
| Living Expense | Trinidad | Colorado | National Average |
|---|---|---|---|
| Overall | 96 | 114 | 100 |
| Services | 106 | 104 | 100 |
| Groceries | 106 | 107 | 100 |
| Health | 78 | 135 | 100 |
| Housing | 103 | 104 | 100 |
| Transportation | 109 | 107 | 100 |
| Utilities | 113 | 107 | 100 |
Source: Cost of living index, normalized to US average = 100
Trinidad, CO Weather
The average high in Trinidad is 65.1° and the average low is 35.6°.
There are 45.7 days of precipitation each year.
Expect an average of 17.1 inches of precipitation each year with 64.7 inches of snow.
| Stat | Trinidad |
|---|---|
| Average Annual High | 65.1 |
| Average Annual Low | 35.6 |
| Annual Precipitation Days | 45.7 |
| Average Annual Precipitation | 17.1 |
| Average Annual Snowfall | 64.7 |
Average High
Days of Rain
Source: NOAA climate normals (30-year)
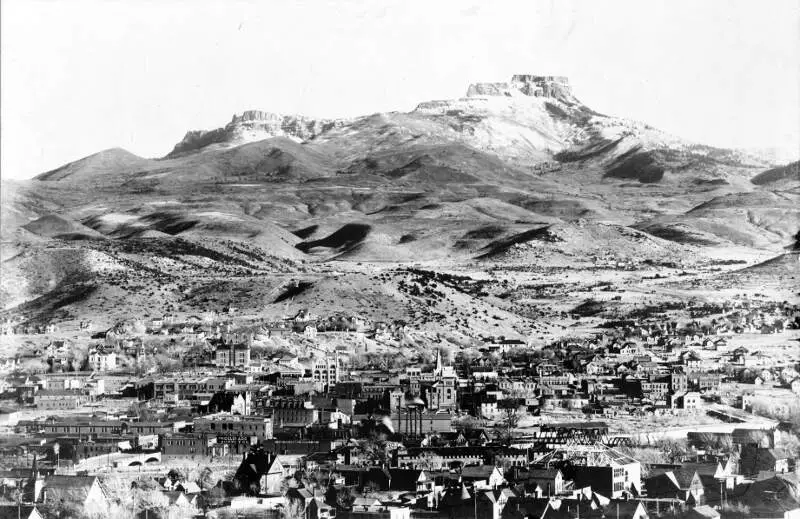
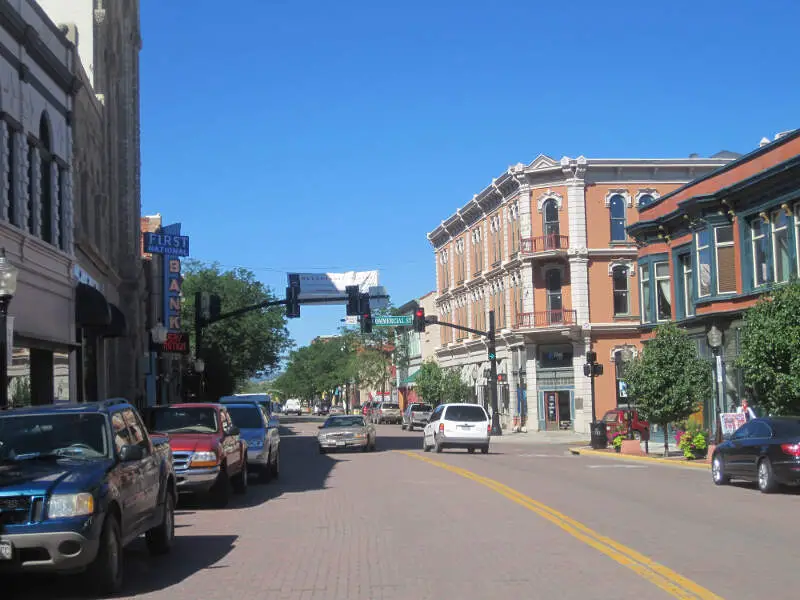
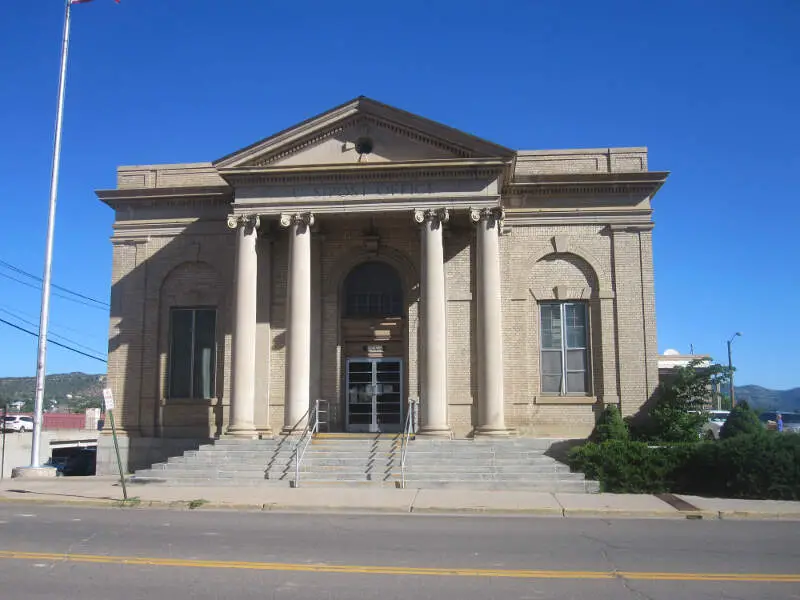
Trinidad, CO Photos


5 Reviews & Comments About Trinidad

I live in Trinidad and you are not telling the truth about us having alot of tacos. We actually have a shortage of mexican restaurants here. We have 2 and both are bad.
I live in Trinidad and it's not bad lol. Just no vacancy.
The crime in this city is outrageous for the size of it, H****n use is on the rise in a a bad way. The parks are unsafe for the children to go to due to the homeless population in this small town. The schools are just as bad serving nasty food and allowing the students to bully one another. this town has over 20 marijuana dispensaries and yet the school system had to cut the buses for the junior high and high school kids forcing them to walk to school. This town does have a lot of businesses that are ran well which makes us wonder what happened to the school
Trinidad Family Dental has a great energy and great staff but keep in mind the staff doesn't live in Trinidad, they commute a good 30 minutes to an hour to work We have great restaurants and great historic views
Pueblo is my hometown and I love it, it was born and raised there. Wouldn't trade it for anything in the world.
I lived in Trinidad for a few years and it was not that bad.
Whatever keeps the Californians away lol. My grandma lived in Trinidad for most of her life. I used to like going to visit her. It wasn't until I got older that I realized her doctor was in fact a transexual lol. So that part is fact.
Rankings & Articles For Trinidad


Locations Around Trinidad
Map Of Trinidad, CO
Best Places Around Trinidad
Raton, NM
Population 6,026
Trinidad Demographics And Statistics
Population over time in Trinidad
The current population in Trinidad is 8,286. The population has decreased 10.3% from 2010.
| Year | Population | % Change |
|---|---|---|
| 2024 | 8,286 | -0.3% |
| 2023 | 8,309 | -0.3% |
| 2022 | 8,334 | 0.2% |
| 2021 | 8,318 | 3.0% |
| 2020 | 8,076 | -0.0% |
| 2019 | 8,080 | 0.5% |
| 2018 | 8,043 | -0.1% |
| 2017 | 8,054 | -2.7% |
| 2016 | 8,280 | -2.2% |
| 2015 | 8,470 | -2.2% |
| 2014 | 8,657 | -2.5% |
| 2013 | 8,880 | -1.7% |
| 2012 | 9,032 | -1.2% |
| 2011 | 9,140 | -1.0% |
| 2010 | 9,236 | - |
Race / Ethnicity in Trinidad
See the full breakdown
Trinidad is:
48.9% White with 4,051 White residents.
1.1% African American with 92 African American residents.
0.1% American Indian with 10 American Indian residents.
1.8% Asian with 146 Asian residents.
0.1% Hawaiian with 9 Hawaiian residents.
0.5% Other with 38 Other residents.
2.8% Two Or More with 231 Two Or More residents.
44.8% Hispanic with 3,709 Hispanic residents.
| Race | Trinidad | CO | USA |
|---|---|---|---|
| White | 48.9% | 64.8% | 57.4% |
| African American | 1.1% | 3.8% | 11.9% |
| American Indian | 0.1% | 0.4% | 0.5% |
| Asian | 1.8% | 3.2% | 5.9% |
| Hawaiian | 0.1% | 0.1% | 0.2% |
| Other | 0.5% | 0.5% | 0.6% |
| Two Or More | 2.8% | 4.6% | 4.3% |
| Hispanic | 44.8% | 22.5% | 19.3% |
Gender in Trinidad
See the full breakdown
Trinidad is 48.4% female with 4,008 female residents.
Trinidad is 51.6% male with 4,278 male residents.
| Gender | Trinidad | CO | USA |
|---|---|---|---|
| Female | 48.4% | 49.3% | 50.5% |
| Male | 51.6% | 50.7% | 49.5% |
Highest level of educational attainment in Trinidad for adults over 25
See the full breakdown
3.0% of adults in Trinidad completed < 9th grade.
5.0% of adults in Trinidad completed 9-12th grade.
28.0% of adults in Trinidad completed high school / ged.
28.0% of adults in Trinidad completed some college.
18.0% of adults in Trinidad completed associate's degree.
13.0% of adults in Trinidad completed bachelor's degree.
3.0% of adults in Trinidad completed master's degree.
1.0% of adults in Trinidad completed professional degree.
1.0% of adults in Trinidad completed doctorate degree.
| Education | Trinidad | CO | USA |
|---|---|---|---|
| < 9th Grade | 3.0% | 3.0% | 4.0% |
| 9-12th Grade | 5.0% | 4.0% | 6.0% |
| High School / GED | 28.0% | 20.0% | 26.0% |
| Some College | 28.0% | 19.0% | 19.0% |
| Associate's Degree | 18.0% | 8.0% | 9.0% |
| Bachelor's Degree | 13.0% | 28.0% | 22.0% |
| Master's Degree | 3.0% | 13.0% | 10.0% |
| Professional Degree | 1.0% | 3.0% | 2.0% |
| Doctorate Degree | 1.0% | 2.0% | 2.0% |
Household Income For Trinidad, Colorado
See the full breakdown
7.1% of households in Trinidad earn Less than $10,000.
8.3% of households in Trinidad earn $10,000 to $14,999.
10.6% of households in Trinidad earn $15,000 to $24,999.
8.6% of households in Trinidad earn $25,000 to $34,999.
13.2% of households in Trinidad earn $35,000 to $49,999.
19.4% of households in Trinidad earn $50,000 to $74,999.
11.1% of households in Trinidad earn $75,000 to $99,999.
12.7% of households in Trinidad earn $100,000 to $149,999.
3.7% of households in Trinidad earn $150,000 to $199,999.
5.3% of households in Trinidad earn $200,000 or more.
| Income | Trinidad | CO | USA |
|---|---|---|---|
| Less than $10,000 | 7.1% | 3.9% | 5.0% |
| $10,000 to $14,999 | 8.3% | 2.4% | 3.4% |
| $15,000 to $24,999 | 10.6% | 4.8% | 6.3% |
| $25,000 to $34,999 | 8.6% | 5.2% | 6.6% |
| $35,000 to $49,999 | 13.2% | 8.4% | 10.1% |
| $50,000 to $74,999 | 19.4% | 14.6% | 15.5% |
| $75,000 to $99,999 | 11.1% | 12.8% | 12.6% |
| $100,000 to $149,999 | 12.7% | 19.2% | 17.5% |
| $150,000 to $199,999 | 3.7% | 11.7% | 9.6% |
| $200,000 or more | 5.3% | 17.0% | 13.4% |
Source: U.S. Census ACS 5-year estimates (2024)


