Altamonte Springs SnackAbility
Overall SnackAbility
Crime in Altamonte Springs summary. We use data from the FBI to determine the crime rates in Altamonte Springs. Key points include:
There were 1,192 total crimes in Altamonte Springs in the last reporting year.
The overall crime rate per 100,000 people in Altamonte Springs is 2,651.5 / 100k people.
The violent crime rate per 100,000 people in Altamonte Springs is 340.3 / 100k people.
The property crime rate per 100,000 people in Altamonte Springs is 2,311.1 / 100k people.
Overall, crime in Altamonte Springs is 25.12% above the national average.
Total Crimes
Above National Average
Crime In Altamonte Springs Comparison Table
| Statistic | Count Raw |
Altamonte Springs / 100k People |
Florida / 100k People |
National / 100k People |
|---|---|---|---|---|
| Total Crimes Per 100K | 1,192 | 2,651.5 | 1,687.5 | 2,119.2 |
| Violent Crime | 153 | 340.3 | 267.1 | 359.0 |
| Murder | 0 | 0.0 | 3.9 | 5.0 |
| Robbery | 23 | 51.2 | 38.2 | 61.0 |
| Aggravated Assault | 118 | 262.5 | 197.1 | 256.0 |
| Property Crime | 1,039 | 2,311.1 | 1,420.4 | 1,760.0 |
| Burglary | 75 | 166.8 | 152.5 | 229.0 |
| Larceny | 911 | 2,026.4 | 1,144.9 | 1,272.0 |
| Car Theft | 53 | 117.9 | 123.0 | 259.0 |
Source: FBI Uniform Crime Reporting (2024)
Cost of living in Altamonte Springs summary. We use data on the cost of living to determine how expensive it is to live in Altamonte Springs. Real estate prices drive most of the variance in cost of living around Florida. Key points include:
The cost of living in Altamonte Springs is 107 with 100 being average.
The cost of living in Altamonte Springs is 1.1x higher than the national average.
The median home value in Altamonte Springs is $294,423.
The median income in Altamonte Springs is $64,070.
Altamonte Springs's Overall Cost Of Living
Higher Than The National Average
Cost Of Living In Altamonte Springs Comparison Table
| Living Expense | Altamonte Springs | Florida | National Average |
|---|---|---|---|
| Overall | 107 | 104 | 100 |
| Services | 101 | 101 | 100 |
| Groceries | 103 | 105 | 100 |
| Health | 113 | 99 | 100 |
| Housing | 103 | 104 | 100 |
| Transportation | 108 | 109 | 100 |
| Utilities | 106 | 105 | 100 |
Source: Cost of living index, normalized to US average = 100
Altamonte Springs, FL Weather
The average high in Altamonte Springs is 82.4° and the average low is 61.7°.
There are 79.7 days of precipitation each year.
Expect an average of 50.4 inches of precipitation each year with 0.0 inches of snow.
| Stat | Altamonte Springs |
|---|---|
| Average Annual High | 82.4 |
| Average Annual Low | 61.7 |
| Annual Precipitation Days | 79.7 |
| Average Annual Precipitation | 50.4 |
| Average Annual Snowfall | 0.0 |
Average High
Days of Rain
Source: NOAA climate normals (30-year)
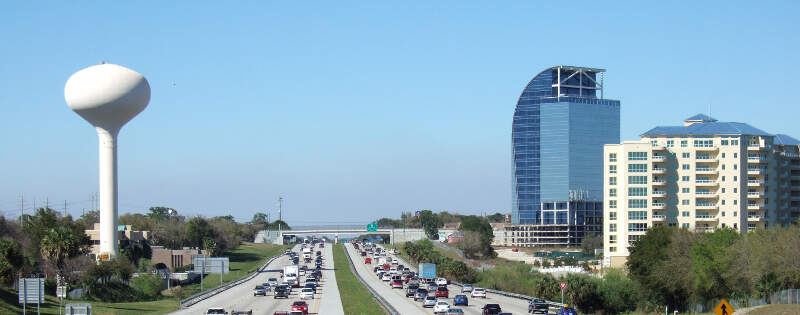
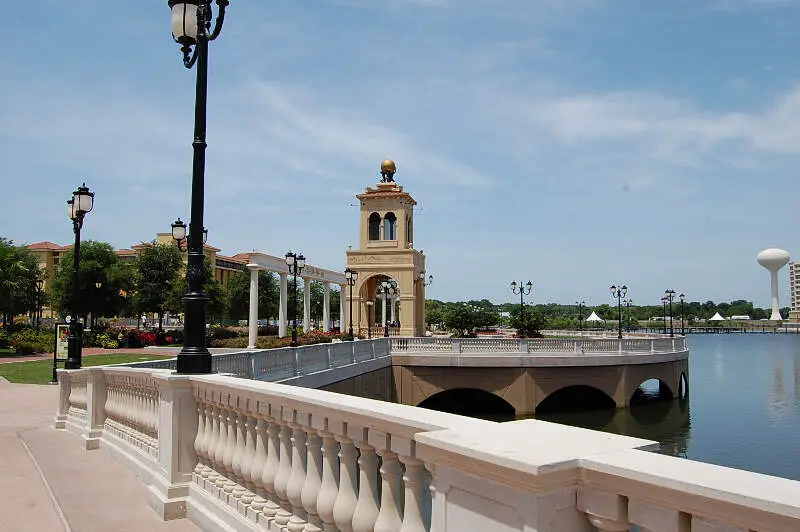
Altamonte Springs, FL Photos

Rankings & Articles For Altamonte Springs


Locations Around Altamonte Springs
Map Of Altamonte Springs, FL
Best Places Around Altamonte Springs
Conway, FL
Population 12,928
Winter Park, FL
Population 30,274
Maitland, FL
Population 19,469
Wekiwa Springs, FL
Population 23,915
Doctor Phillips, FL
Population 12,984
Oviedo, FL
Population 40,599
Winter Springs, FL
Population 38,951
Ocoee, FL
Population 49,033
Lockhart, FL
Population 15,371
Lake Mary, FL
Population 16,860
Altamonte Springs Demographics And Statistics
Population over time in Altamonte Springs
The current population in Altamonte Springs is 46,116. The population has increased 9.5% from 2010.
| Year | Population | % Change |
|---|---|---|
| 2024 | 46,116 | 1.0% |
| 2023 | 45,657 | -0.3% |
| 2022 | 45,772 | 0.1% |
| 2021 | 45,732 | 4.0% |
| 2020 | 43,969 | 0.4% |
| 2019 | 43,810 | 0.9% |
| 2018 | 43,426 | 0.8% |
| 2017 | 43,084 | 1.2% |
| 2016 | 42,557 | 0.8% |
| 2015 | 42,218 | 0.8% |
| 2014 | 41,889 | 0.2% |
| 2013 | 41,795 | 0.1% |
| 2012 | 41,761 | -0.2% |
| 2011 | 41,857 | -0.7% |
| 2010 | 42,131 | - |
Race / Ethnicity in Altamonte Springs
See the full breakdown
Altamonte Springs is:
41.9% White with 19,333 White residents.
18.7% African American with 8,632 African American residents.
0.0% American Indian with 17 American Indian residents.
2.6% Asian with 1,207 Asian residents.
0.4% Hawaiian with 182 Hawaiian residents.
1.5% Other with 671 Other residents.
4.6% Two Or More with 2,108 Two Or More residents.
30.3% Hispanic with 13,966 Hispanic residents.
| Race | Altamonte Springs | FL | USA |
|---|---|---|---|
| White | 41.9% | 50.4% | 57.4% |
| African American | 18.7% | 14.6% | 11.9% |
| American Indian | 0.0% | 0.1% | 0.5% |
| Asian | 2.6% | 2.9% | 5.9% |
| Hawaiian | 0.4% | 0.1% | 0.2% |
| Other | 1.5% | 0.7% | 0.6% |
| Two Or More | 4.6% | 3.8% | 4.3% |
| Hispanic | 30.3% | 27.4% | 19.3% |
Gender in Altamonte Springs
See the full breakdown
Altamonte Springs is 56.2% female with 25,926 female residents.
Altamonte Springs is 43.8% male with 20,190 male residents.
| Gender | Altamonte Springs | FL | USA |
|---|---|---|---|
| Female | 56.2% | 50.9% | 50.5% |
| Male | 43.8% | 49.1% | 49.5% |
Highest level of educational attainment in Altamonte Springs for adults over 25
See the full breakdown
4.0% of adults in Altamonte Springs completed < 9th grade.
5.0% of adults in Altamonte Springs completed 9-12th grade.
19.0% of adults in Altamonte Springs completed high school / ged.
22.0% of adults in Altamonte Springs completed some college.
12.0% of adults in Altamonte Springs completed associate's degree.
28.0% of adults in Altamonte Springs completed bachelor's degree.
8.0% of adults in Altamonte Springs completed master's degree.
1.0% of adults in Altamonte Springs completed professional degree.
1.0% of adults in Altamonte Springs completed doctorate degree.
| Education | Altamonte Springs | FL | USA |
|---|---|---|---|
| < 9th Grade | 4.0% | 5.0% | 4.0% |
| 9-12th Grade | 5.0% | 6.0% | 6.0% |
| High School / GED | 19.0% | 27.0% | 26.0% |
| Some College | 22.0% | 19.0% | 19.0% |
| Associate's Degree | 12.0% | 10.0% | 9.0% |
| Bachelor's Degree | 28.0% | 21.0% | 22.0% |
| Master's Degree | 8.0% | 9.0% | 10.0% |
| Professional Degree | 1.0% | 2.0% | 2.0% |
| Doctorate Degree | 1.0% | 1.0% | 2.0% |
Household Income For Altamonte Springs, Florida
See the full breakdown
4.3% of households in Altamonte Springs earn Less than $10,000.
2.0% of households in Altamonte Springs earn $10,000 to $14,999.
6.2% of households in Altamonte Springs earn $15,000 to $24,999.
9.8% of households in Altamonte Springs earn $25,000 to $34,999.
14.1% of households in Altamonte Springs earn $35,000 to $49,999.
23.9% of households in Altamonte Springs earn $50,000 to $74,999.
12.0% of households in Altamonte Springs earn $75,000 to $99,999.
18.6% of households in Altamonte Springs earn $100,000 to $149,999.
4.3% of households in Altamonte Springs earn $150,000 to $199,999.
4.8% of households in Altamonte Springs earn $200,000 or more.
| Income | Altamonte Springs | FL | USA |
|---|---|---|---|
| Less than $10,000 | 4.3% | 5.1% | 5.0% |
| $10,000 to $14,999 | 2.0% | 3.3% | 3.4% |
| $15,000 to $24,999 | 6.2% | 6.6% | 6.3% |
| $25,000 to $34,999 | 9.8% | 7.3% | 6.6% |
| $35,000 to $49,999 | 14.1% | 11.1% | 10.1% |
| $50,000 to $74,999 | 23.9% | 16.8% | 15.5% |
| $75,000 to $99,999 | 12.0% | 13.1% | 12.6% |
| $100,000 to $149,999 | 18.6% | 17.2% | 17.5% |
| $150,000 to $199,999 | 4.3% | 8.4% | 9.6% |
| $200,000 or more | 4.8% | 11.0% | 13.4% |
Source: U.S. Census ACS 5-year estimates (2024)


