Clewiston SnackAbility
Overall SnackAbility
Crime in Clewiston summary. We use data from the FBI to determine the crime rates in Clewiston. Key points include:
There were 37 total crimes in Clewiston in the last reporting year.
The overall crime rate per 100,000 people in Clewiston is 513.0 / 100k people.
The violent crime rate per 100,000 people in Clewiston is 152.5 / 100k people.
The property crime rate per 100,000 people in Clewiston is 360.5 / 100k people.
Overall, crime in Clewiston is -75.79% below the national average.
Total Crimes
Below National Average
Crime In Clewiston Comparison Table
| Statistic | Count Raw |
Clewiston / 100k People |
Florida / 100k People |
National / 100k People |
|---|---|---|---|---|
| Total Crimes Per 100K | 37 | 513.0 | 1,687.5 | 2,119.2 |
| Violent Crime | 11 | 152.5 | 267.1 | 359.0 |
| Murder | 0 | 0.0 | 3.9 | 5.0 |
| Robbery | 0 | 0.0 | 38.2 | 61.0 |
| Aggravated Assault | 10 | 138.7 | 197.1 | 256.0 |
| Property Crime | 26 | 360.5 | 1,420.4 | 1,760.0 |
| Burglary | 4 | 55.5 | 152.5 | 229.0 |
| Larceny | 21 | 291.2 | 1,144.9 | 1,272.0 |
| Car Theft | 1 | 13.9 | 123.0 | 259.0 |
Source: FBI Uniform Crime Reporting (2024)
Cost of living in Clewiston summary. We use data on the cost of living to determine how expensive it is to live in Clewiston. Real estate prices drive most of the variance in cost of living around Florida. Key points include:
The cost of living in Clewiston is 98 with 100 being average.
The cost of living in Clewiston is 1.0x lower than the national average.
The median home value in Clewiston is $253,570.
The median income in Clewiston is $57,222.
Clewiston's Overall Cost Of Living
Lower Than The National Average
Cost Of Living In Clewiston Comparison Table
| Living Expense | Clewiston | Florida | National Average |
|---|---|---|---|
| Overall | 98 | 104 | 100 |
| Services | 102 | 101 | 100 |
| Groceries | 102 | 105 | 100 |
| Health | 75 | 99 | 100 |
| Housing | 107 | 104 | 100 |
| Transportation | 113 | 109 | 100 |
| Utilities | 102 | 105 | 100 |
Source: Cost of living index, normalized to US average = 100
Clewiston, FL Weather
The average high in Clewiston is 84.4° and the average low is 63.0°.
There are 72.2 days of precipitation each year.
Expect an average of 47.0 inches of precipitation each year with 0.0 inches of snow.
| Stat | Clewiston |
|---|---|
| Average Annual High | 84.4 |
| Average Annual Low | 63.0 |
| Annual Precipitation Days | 72.2 |
| Average Annual Precipitation | 47.0 |
| Average Annual Snowfall | 0.0 |
Average High
Days of Rain
Source: NOAA climate normals (30-year)
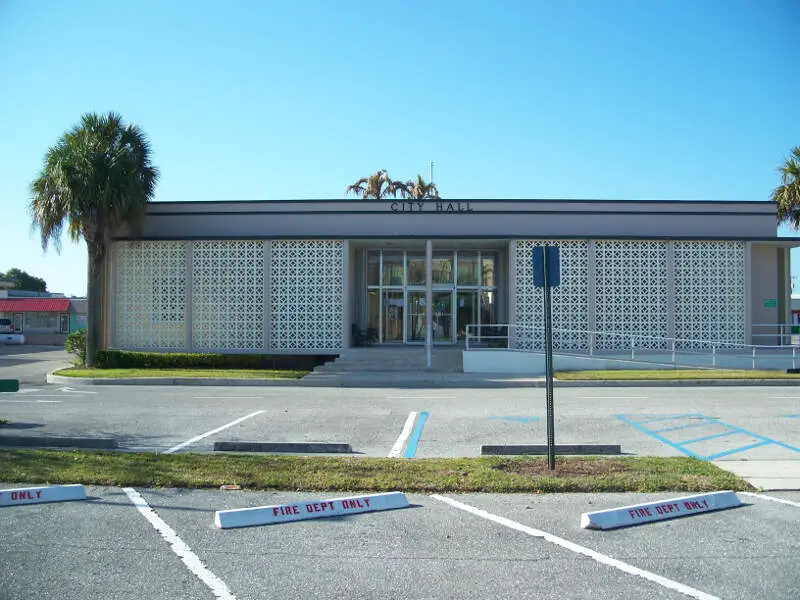
Clewiston, FL Photos
Rankings & Articles For Clewiston


Locations Around Clewiston
Map Of Clewiston, FL
Best Places Around Clewiston
Royal Palm Beach, FL
Population 40,344
Palm Beach Gardens, FL
Population 60,959
Jupiter Farms, FL
Population 12,945
The Acreage, FL
Population 40,843
Wellington, FL
Population 62,146
Belle Glade, FL
Population 16,972
Port St. Lucie, FL
Population 232,491
Immokalee, FL
Population 26,361
Lehigh Acres, FL
Population 132,353
Clewiston Demographics And Statistics
Population over time in Clewiston
The current population in Clewiston is 7,348. The population has increased 3.2% from 2010.
| Year | Population | % Change |
|---|---|---|
| 2024 | 7,348 | 1.3% |
| 2023 | 7,257 | 0.1% |
| 2022 | 7,252 | -2.6% |
| 2021 | 7,447 | -5.9% |
| 2020 | 7,910 | 1.7% |
| 2019 | 7,781 | 1.5% |
| 2018 | 7,663 | 3.1% |
| 2017 | 7,430 | 1.2% |
| 2016 | 7,343 | 1.4% |
| 2015 | 7,240 | 0.8% |
| 2014 | 7,184 | 0.9% |
| 2013 | 7,119 | 0.0% |
| 2012 | 7,118 | -0.3% |
| 2011 | 7,142 | 0.3% |
| 2010 | 7,122 | - |
Race / Ethnicity in Clewiston
See the full breakdown
Clewiston is:
37.5% White with 2,752 White residents.
9.5% African American with 700 African American residents.
0.1% American Indian with 7 American Indian residents.
1.6% Asian with 121 Asian residents.
0.0% Hawaiian with 0 Hawaiian residents.
0.0% Other with 0 Other residents.
0.4% Two Or More with 31 Two Or More residents.
50.9% Hispanic with 3,737 Hispanic residents.
| Race | Clewiston | FL | USA |
|---|---|---|---|
| White | 37.5% | 50.4% | 57.4% |
| African American | 9.5% | 14.6% | 11.9% |
| American Indian | 0.1% | 0.1% | 0.5% |
| Asian | 1.6% | 2.9% | 5.9% |
| Hawaiian | 0.0% | 0.1% | 0.2% |
| Other | 0.0% | 0.7% | 0.6% |
| Two Or More | 0.4% | 3.8% | 4.3% |
| Hispanic | 50.9% | 27.4% | 19.3% |
Gender in Clewiston
See the full breakdown
Clewiston is 51.5% female with 3,785 female residents.
Clewiston is 48.5% male with 3,562 male residents.
| Gender | Clewiston | FL | USA |
|---|---|---|---|
| Female | 51.5% | 50.9% | 50.5% |
| Male | 48.5% | 49.1% | 49.5% |
Highest level of educational attainment in Clewiston for adults over 25
See the full breakdown
18.0% of adults in Clewiston completed < 9th grade.
12.0% of adults in Clewiston completed 9-12th grade.
30.0% of adults in Clewiston completed high school / ged.
17.0% of adults in Clewiston completed some college.
6.0% of adults in Clewiston completed associate's degree.
11.0% of adults in Clewiston completed bachelor's degree.
4.0% of adults in Clewiston completed master's degree.
2.0% of adults in Clewiston completed professional degree.
0.0% of adults in Clewiston completed doctorate degree.
| Education | Clewiston | FL | USA |
|---|---|---|---|
| < 9th Grade | 18.0% | 5.0% | 4.0% |
| 9-12th Grade | 12.0% | 6.0% | 6.0% |
| High School / GED | 30.0% | 27.0% | 26.0% |
| Some College | 17.0% | 19.0% | 19.0% |
| Associate's Degree | 6.0% | 10.0% | 9.0% |
| Bachelor's Degree | 11.0% | 21.0% | 22.0% |
| Master's Degree | 4.0% | 9.0% | 10.0% |
| Professional Degree | 2.0% | 2.0% | 2.0% |
| Doctorate Degree | 0.0% | 1.0% | 2.0% |
Household Income For Clewiston, Florida
See the full breakdown
6.3% of households in Clewiston earn Less than $10,000.
3.9% of households in Clewiston earn $10,000 to $14,999.
10.3% of households in Clewiston earn $15,000 to $24,999.
12.6% of households in Clewiston earn $25,000 to $34,999.
10.6% of households in Clewiston earn $35,000 to $49,999.
14.1% of households in Clewiston earn $50,000 to $74,999.
8.2% of households in Clewiston earn $75,000 to $99,999.
20.5% of households in Clewiston earn $100,000 to $149,999.
10.2% of households in Clewiston earn $150,000 to $199,999.
3.2% of households in Clewiston earn $200,000 or more.
| Income | Clewiston | FL | USA |
|---|---|---|---|
| Less than $10,000 | 6.3% | 5.1% | 5.0% |
| $10,000 to $14,999 | 3.9% | 3.3% | 3.4% |
| $15,000 to $24,999 | 10.3% | 6.6% | 6.3% |
| $25,000 to $34,999 | 12.6% | 7.3% | 6.6% |
| $35,000 to $49,999 | 10.6% | 11.1% | 10.1% |
| $50,000 to $74,999 | 14.1% | 16.8% | 15.5% |
| $75,000 to $99,999 | 8.2% | 13.1% | 12.6% |
| $100,000 to $149,999 | 20.5% | 17.2% | 17.5% |
| $150,000 to $199,999 | 10.2% | 8.4% | 9.6% |
| $200,000 or more | 3.2% | 11.0% | 13.4% |
Source: U.S. Census ACS 5-year estimates (2024)


