Coral Gables SnackAbility
Overall SnackAbility
Crime in Coral Gables summary. We use data from the FBI to determine the crime rates in Coral Gables. Key points include:
There were 1,085 total crimes in Coral Gables in the last reporting year.
The overall crime rate per 100,000 people in Coral Gables is 2,217.9 / 100k people.
The violent crime rate per 100,000 people in Coral Gables is 110.4 / 100k people.
The property crime rate per 100,000 people in Coral Gables is 2,107.5 / 100k people.
Overall, crime in Coral Gables is 4.66% above the national average.
Total Crimes
Above National Average
Crime In Coral Gables Comparison Table
| Statistic | Count Raw |
Coral Gables / 100k People |
Florida / 100k People |
National / 100k People |
|---|---|---|---|---|
| Total Crimes Per 100K | 1,085 | 2,217.9 | 1,687.5 | 2,119.2 |
| Violent Crime | 54 | 110.4 | 267.1 | 359.0 |
| Murder | 0 | 0.0 | 3.9 | 5.0 |
| Robbery | 15 | 30.7 | 38.2 | 61.0 |
| Aggravated Assault | 36 | 73.6 | 197.1 | 256.0 |
| Property Crime | 1,031 | 2,107.5 | 1,420.4 | 1,760.0 |
| Burglary | 70 | 143.1 | 152.5 | 229.0 |
| Larceny | 955 | 1,952.2 | 1,144.9 | 1,272.0 |
| Car Theft | 6 | 12.3 | 123.0 | 259.0 |
Source: FBI Uniform Crime Reporting (2024)
Cost of living in Coral Gables summary. We use data on the cost of living to determine how expensive it is to live in Coral Gables. Real estate prices drive most of the variance in cost of living around Florida. Key points include:
The cost of living in Coral Gables is 191 with 100 being average.
The cost of living in Coral Gables is 1.9x higher than the national average.
The median home value in Coral Gables is $1,516,825.
The median income in Coral Gables is $134,216.
Coral Gables's Overall Cost Of Living
Higher Than The National Average
Cost Of Living In Coral Gables Comparison Table
| Living Expense | Coral Gables | Florida | National Average |
|---|---|---|---|
| Overall | 191 | 104 | 100 |
| Services | 103 | 101 | 100 |
| Groceries | 102 | 105 | 100 |
| Health | 394 | 99 | 100 |
| Housing | 104 | 104 | 100 |
| Transportation | 111 | 109 | 100 |
| Utilities | 111 | 105 | 100 |
Source: Cost of living index, normalized to US average = 100
Coral Gables, FL Weather
The average high in Coral Gables is 83.3° and the average low is 69.5°.
There are 93.9 days of precipitation each year.
Expect an average of 60.7 inches of precipitation each year with 0.0 inches of snow.
| Stat | Coral Gables |
|---|---|
| Average Annual High | 83.3 |
| Average Annual Low | 69.5 |
| Annual Precipitation Days | 93.9 |
| Average Annual Precipitation | 60.7 |
| Average Annual Snowfall | 0.0 |
Average High
Days of Rain
Source: NOAA climate normals (30-year)
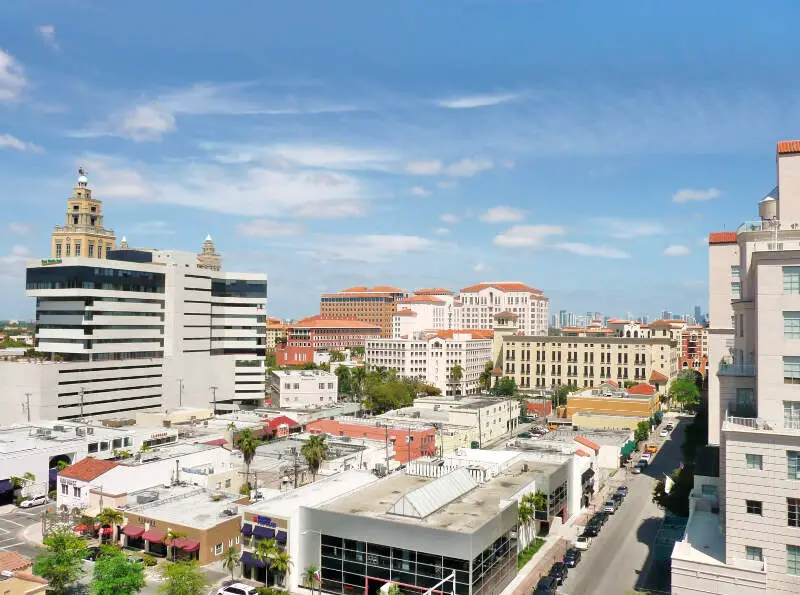
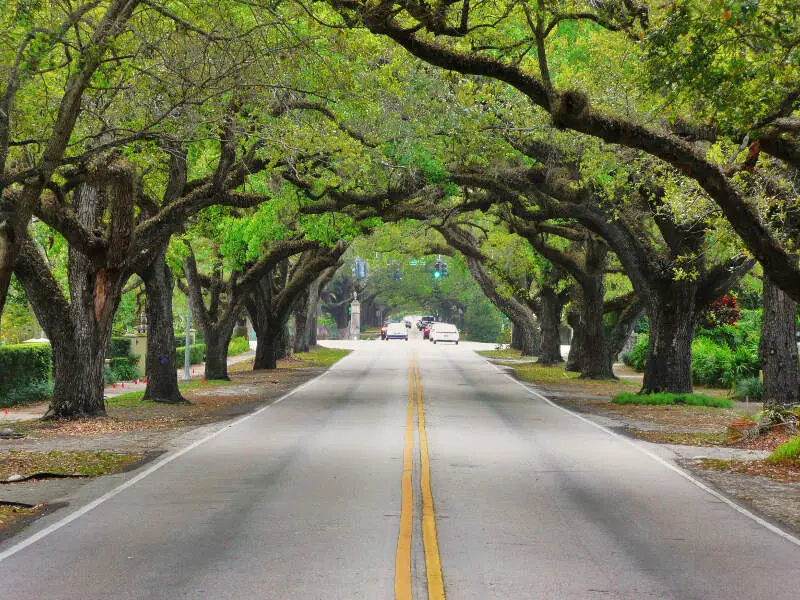
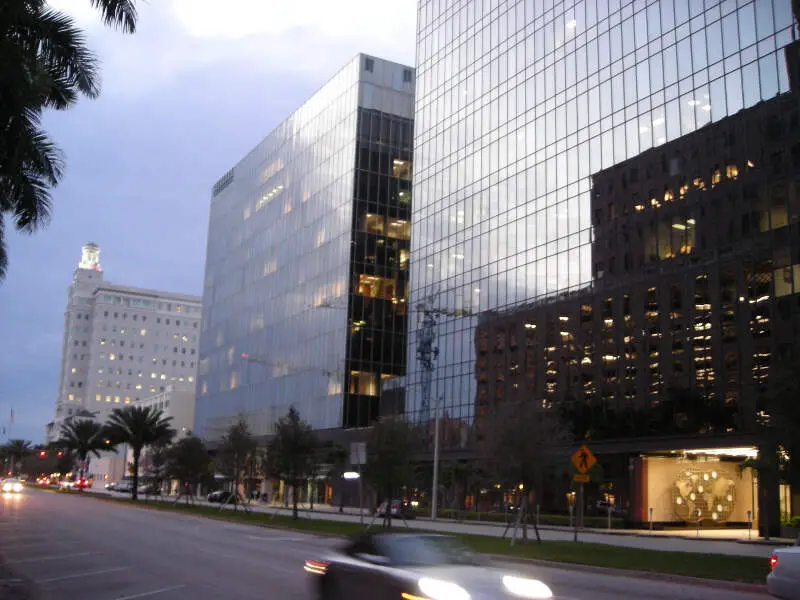
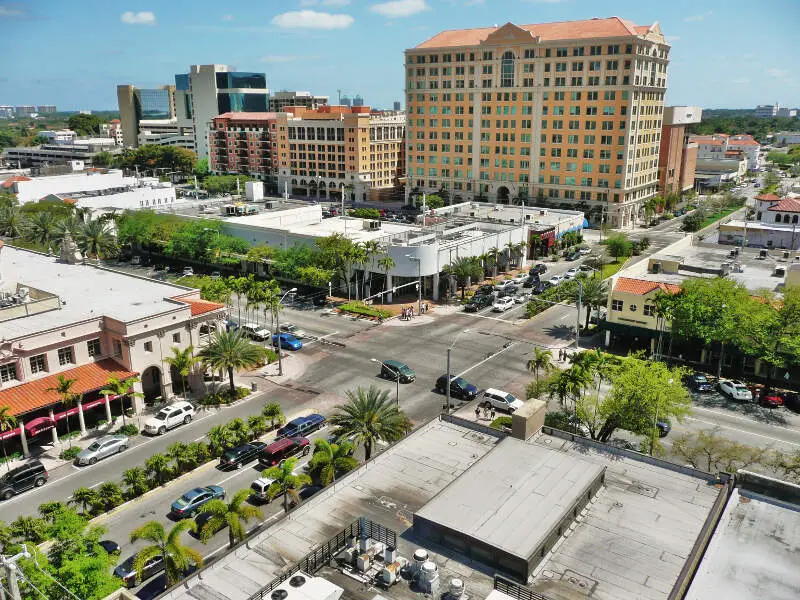
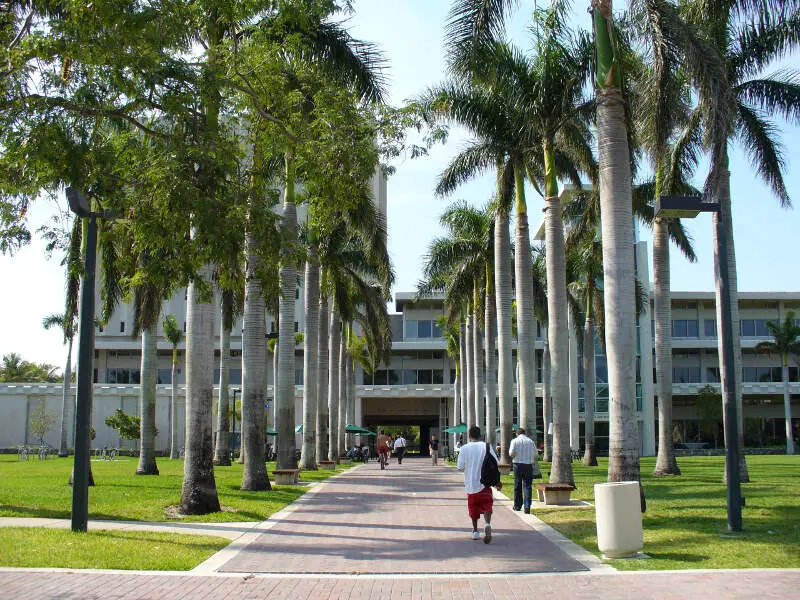
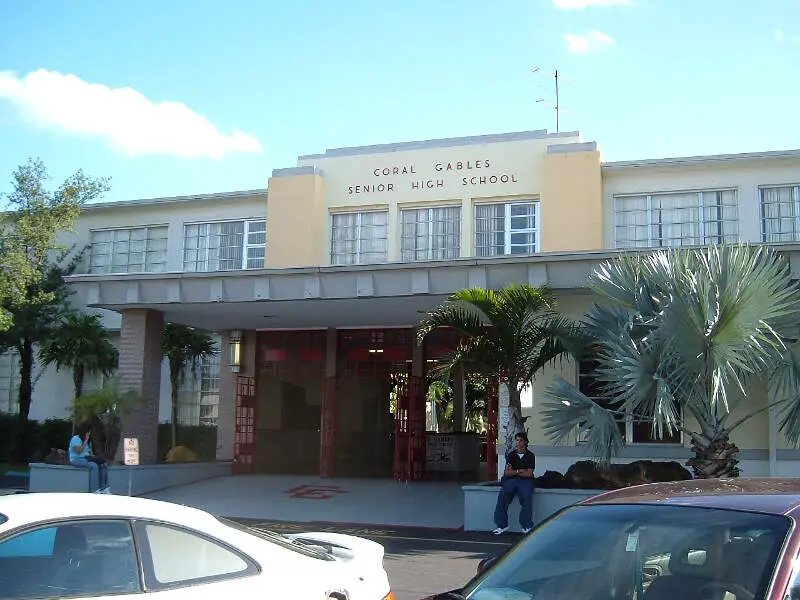
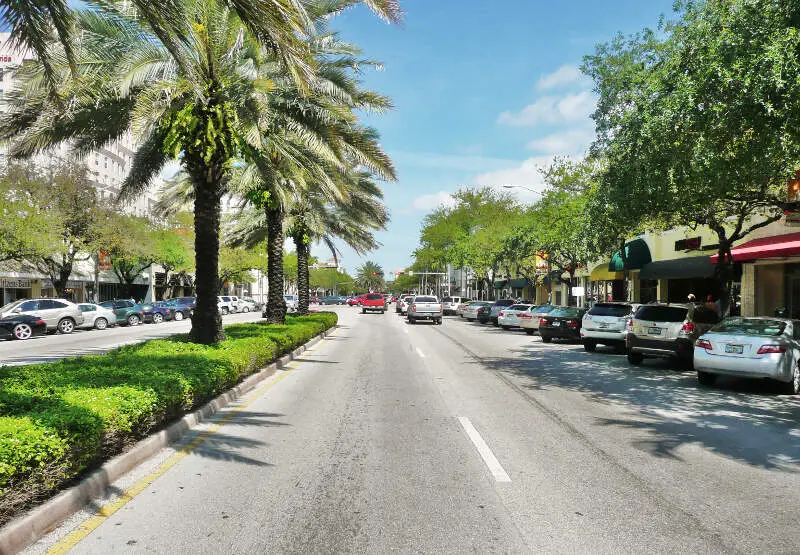
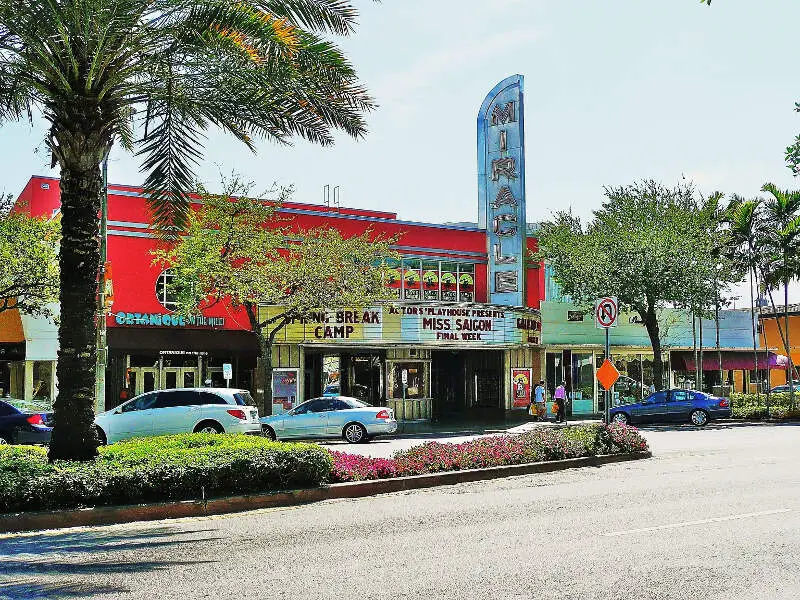
Coral Gables, FL Photos

1 Reviews & Comments About Coral Gables

Coral Gables is a world-class neighborhood. The school system is one of the best in the nation and crime is almost non-existent. Aside from high real estate prices, definitely the place to be.
Miracle mile is definitely the highlight of Coral Gables. A fun place to walk around, shop and dine to your heart's content.
Rankings & Articles For Coral Gables


Locations Around Coral Gables
Map Of Coral Gables, FL
Best Places Around Coral Gables
Richmond West, FL
Population 35,593
Coral Terrace, FL
Population 24,895
The Crossings, FL
Population 22,963
Palmetto Estates, FL
Population 16,129
Country Walk, FL
Population 19,291
Sunset, FL
Population 13,535
Kendale Lakes, FL
Population 52,622
Miami Lakes, FL
Population 31,553
Tamiami, FL
Population 49,752
Three Lakes, FL
Population 16,888
Coral Gables Demographics And Statistics
Population over time in Coral Gables
The current population in Coral Gables is 49,802. The population has increased 8.4% from 2010.
| Year | Population | % Change |
|---|---|---|
| 2024 | 49,802 | 1.1% |
| 2023 | 49,243 | -0.9% |
| 2022 | 49,696 | 0.9% |
| 2021 | 49,269 | -1.3% |
| 2020 | 49,937 | -0.6% |
| 2019 | 50,226 | -1.4% |
| 2018 | 50,931 | 0.0% |
| 2017 | 50,909 | 0.7% |
| 2016 | 50,533 | 0.9% |
| 2015 | 50,059 | 1.5% |
| 2014 | 49,319 | 2.5% |
| 2013 | 48,093 | 1.7% |
| 2012 | 47,285 | 1.8% |
| 2011 | 46,442 | 1.1% |
| 2010 | 45,955 | - |
Race / Ethnicity in Coral Gables
See the full breakdown
Coral Gables is:
32.3% White with 16,107 White residents.
3.7% African American with 1,851 African American residents.
0.0% American Indian with 12 American Indian residents.
3.1% Asian with 1,533 Asian residents.
0.0% Hawaiian with 0 Hawaiian residents.
0.7% Other with 339 Other residents.
3.5% Two Or More with 1,748 Two Or More residents.
56.6% Hispanic with 28,212 Hispanic residents.
| Race | Coral Gables | FL | USA |
|---|---|---|---|
| White | 32.3% | 50.4% | 57.4% |
| African American | 3.7% | 14.6% | 11.9% |
| American Indian | 0.0% | 0.1% | 0.5% |
| Asian | 3.1% | 2.9% | 5.9% |
| Hawaiian | 0.0% | 0.1% | 0.2% |
| Other | 0.7% | 0.7% | 0.6% |
| Two Or More | 3.5% | 3.8% | 4.3% |
| Hispanic | 56.6% | 27.4% | 19.3% |
Gender in Coral Gables
See the full breakdown
Coral Gables is 53.7% female with 26,753 female residents.
Coral Gables is 46.3% male with 23,049 male residents.
| Gender | Coral Gables | FL | USA |
|---|---|---|---|
| Female | 53.7% | 50.9% | 50.5% |
| Male | 46.3% | 49.1% | 49.5% |
Highest level of educational attainment in Coral Gables for adults over 25
See the full breakdown
3.0% of adults in Coral Gables completed < 9th grade.
2.0% of adults in Coral Gables completed 9-12th grade.
9.0% of adults in Coral Gables completed high school / ged.
8.0% of adults in Coral Gables completed some college.
5.0% of adults in Coral Gables completed associate's degree.
32.0% of adults in Coral Gables completed bachelor's degree.
24.0% of adults in Coral Gables completed master's degree.
13.0% of adults in Coral Gables completed professional degree.
4.0% of adults in Coral Gables completed doctorate degree.
| Education | Coral Gables | FL | USA |
|---|---|---|---|
| < 9th Grade | 3.0% | 5.0% | 4.0% |
| 9-12th Grade | 2.0% | 6.0% | 6.0% |
| High School / GED | 9.0% | 27.0% | 26.0% |
| Some College | 8.0% | 19.0% | 19.0% |
| Associate's Degree | 5.0% | 10.0% | 9.0% |
| Bachelor's Degree | 32.0% | 21.0% | 22.0% |
| Master's Degree | 24.0% | 9.0% | 10.0% |
| Professional Degree | 13.0% | 2.0% | 2.0% |
| Doctorate Degree | 4.0% | 1.0% | 2.0% |
Household Income For Coral Gables, Florida
See the full breakdown
6.0% of households in Coral Gables earn Less than $10,000.
1.4% of households in Coral Gables earn $10,000 to $14,999.
5.6% of households in Coral Gables earn $15,000 to $24,999.
4.2% of households in Coral Gables earn $25,000 to $34,999.
5.7% of households in Coral Gables earn $35,000 to $49,999.
8.6% of households in Coral Gables earn $50,000 to $74,999.
7.3% of households in Coral Gables earn $75,000 to $99,999.
14.5% of households in Coral Gables earn $100,000 to $149,999.
9.7% of households in Coral Gables earn $150,000 to $199,999.
37.0% of households in Coral Gables earn $200,000 or more.
| Income | Coral Gables | FL | USA |
|---|---|---|---|
| Less than $10,000 | 6.0% | 5.1% | 5.0% |
| $10,000 to $14,999 | 1.4% | 3.3% | 3.4% |
| $15,000 to $24,999 | 5.6% | 6.6% | 6.3% |
| $25,000 to $34,999 | 4.2% | 7.3% | 6.6% |
| $35,000 to $49,999 | 5.7% | 11.1% | 10.1% |
| $50,000 to $74,999 | 8.6% | 16.8% | 15.5% |
| $75,000 to $99,999 | 7.3% | 13.1% | 12.6% |
| $100,000 to $149,999 | 14.5% | 17.2% | 17.5% |
| $150,000 to $199,999 | 9.7% | 8.4% | 9.6% |
| $200,000 or more | 37.0% | 11.0% | 13.4% |
Source: U.S. Census ACS 5-year estimates (2024)


