Daytona Beach SnackAbility
Overall SnackAbility
Crime in Daytona Beach summary. We use data from the FBI to determine the crime rates in Daytona Beach. Key points include:
There were 2,779 total crimes in Daytona Beach in the last reporting year.
The overall crime rate per 100,000 people in Daytona Beach is 3,603.0 / 100k people.
The violent crime rate per 100,000 people in Daytona Beach is 928.3 / 100k people.
The property crime rate per 100,000 people in Daytona Beach is 2,674.7 / 100k people.
Overall, crime in Daytona Beach is 70.01% above the national average.
Total Crimes
Above National Average
Crime In Daytona Beach Comparison Table
| Statistic | Count Raw |
Daytona Beach / 100k People |
Florida / 100k People |
National / 100k People |
|---|---|---|---|---|
| Total Crimes Per 100K | 2,779 | 3,603.0 | 1,687.5 | 2,119.2 |
| Violent Crime | 716 | 928.3 | 267.1 | 359.0 |
| Murder | 13 | 16.9 | 3.9 | 5.0 |
| Robbery | 65 | 84.3 | 38.2 | 61.0 |
| Aggravated Assault | 583 | 755.9 | 197.1 | 256.0 |
| Property Crime | 2,063 | 2,674.7 | 1,420.4 | 1,760.0 |
| Burglary | 259 | 335.8 | 152.5 | 229.0 |
| Larceny | 1,560 | 2,022.6 | 1,144.9 | 1,272.0 |
| Car Theft | 244 | 316.3 | 123.0 | 259.0 |
Source: FBI Uniform Crime Reporting (2024)
Cost of living in Daytona Beach summary. We use data on the cost of living to determine how expensive it is to live in Daytona Beach. Real estate prices drive most of the variance in cost of living around Florida. Key points include:
The cost of living in Daytona Beach is 103 with 100 being average.
The cost of living in Daytona Beach is 1.0x higher than the national average.
The median home value in Daytona Beach is $247,128.
The median income in Daytona Beach is $52,058.
Daytona Beach's Overall Cost Of Living
Higher Than The National Average
Cost Of Living In Daytona Beach Comparison Table
| Living Expense | Daytona Beach | Florida | National Average |
|---|---|---|---|
| Overall | 103 | 104 | 100 |
| Services | 105 | 101 | 100 |
| Groceries | 108 | 105 | 100 |
| Health | 94 | 99 | 100 |
| Housing | 102 | 104 | 100 |
| Transportation | 110 | 109 | 100 |
| Utilities | 108 | 105 | 100 |
Source: Cost of living index, normalized to US average = 100
Daytona Beach, FL Weather
The average high in Daytona Beach is 80.1° and the average low is 61.6°.
There are 76.6 days of precipitation each year.
Expect an average of 51.5 inches of precipitation each year with 0.0 inches of snow.
| Stat | Daytona Beach |
|---|---|
| Average Annual High | 80.1 |
| Average Annual Low | 61.6 |
| Annual Precipitation Days | 76.6 |
| Average Annual Precipitation | 51.5 |
| Average Annual Snowfall | 0.0 |
Average High
Days of Rain
Source: NOAA climate normals (30-year)
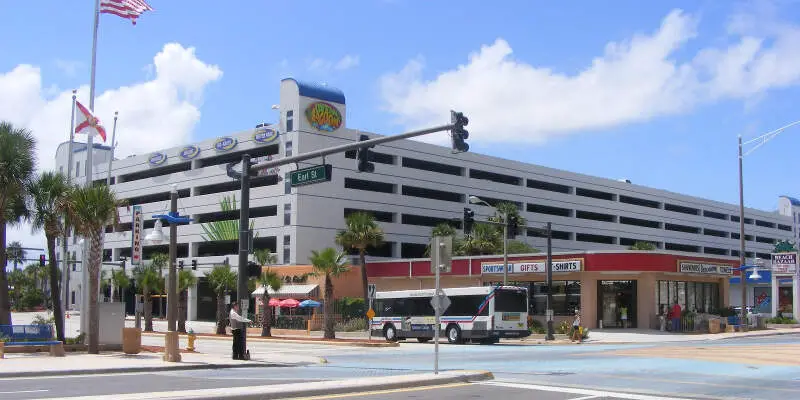
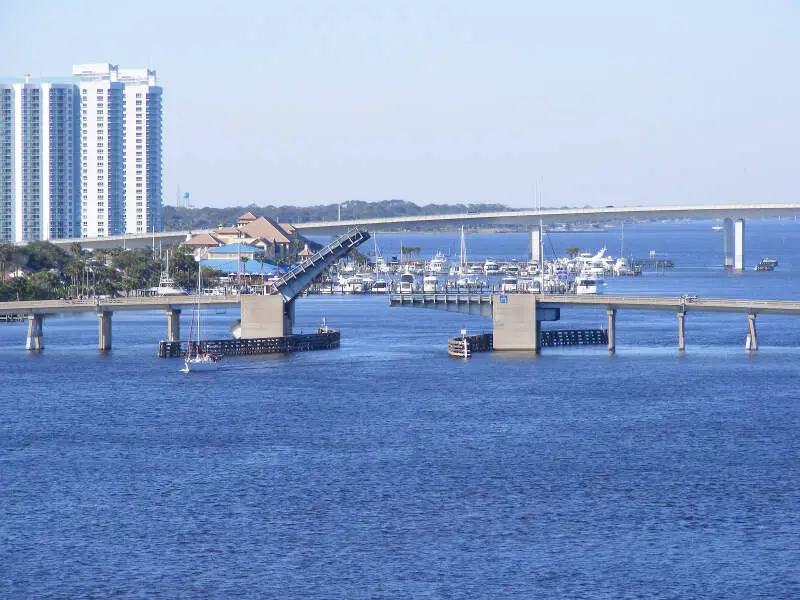
Daytona Beach, FL Photos


Rankings & Articles For Daytona Beach


Locations Around Daytona Beach
Map Of Daytona Beach, FL
Best Places Around Daytona Beach
Port Orange, FL
Population 64,767
Ormond Beach, FL
Population 43,976
Edgewater, FL
Population 23,627
South Daytona, FL
Population 13,543
DeLand, FL
Population 41,611
Holly Hill, FL
Population 13,084
New Smyrna Beach, FL
Population 31,974
Daytona Beach Demographics And Statistics
Population over time in Daytona Beach
The current population in Daytona Beach is 78,992. The population has increased 25.6% from 2010.
| Year | Population | % Change |
|---|---|---|
| 2024 | 78,992 | 4.0% |
| 2023 | 75,924 | 3.5% |
| 2022 | 73,329 | 3.2% |
| 2021 | 71,041 | 3.4% |
| 2020 | 68,711 | 1.6% |
| 2019 | 67,604 | 1.6% |
| 2018 | 66,520 | 1.8% |
| 2017 | 65,339 | 1.9% |
| 2016 | 64,105 | 2.2% |
| 2015 | 62,726 | 1.3% |
| 2014 | 61,913 | 0.5% |
| 2013 | 61,622 | -0.3% |
| 2012 | 61,779 | -0.7% |
| 2011 | 62,186 | -1.1% |
| 2010 | 62,905 | - |
Race / Ethnicity in Daytona Beach
See the full breakdown
Daytona Beach is:
52.6% White with 41,551 White residents.
29.8% African American with 23,512 African American residents.
0.2% American Indian with 130 American Indian residents.
2.9% Asian with 2,275 Asian residents.
0.0% Hawaiian with 35 Hawaiian residents.
0.4% Other with 348 Other residents.
4.2% Two Or More with 3,307 Two Or More residents.
9.9% Hispanic with 7,834 Hispanic residents.
| Race | Daytona Beach | FL | USA |
|---|---|---|---|
| White | 52.6% | 50.4% | 57.4% |
| African American | 29.8% | 14.6% | 11.9% |
| American Indian | 0.2% | 0.1% | 0.5% |
| Asian | 2.9% | 2.9% | 5.9% |
| Hawaiian | 0.0% | 0.1% | 0.2% |
| Other | 0.4% | 0.7% | 0.6% |
| Two Or More | 4.2% | 3.8% | 4.3% |
| Hispanic | 9.9% | 27.4% | 19.3% |
Gender in Daytona Beach
See the full breakdown
Daytona Beach is 49.4% female with 39,011 female residents.
Daytona Beach is 50.6% male with 39,981 male residents.
| Gender | Daytona Beach | FL | USA |
|---|---|---|---|
| Female | 49.4% | 50.9% | 50.5% |
| Male | 50.6% | 49.1% | 49.5% |
Highest level of educational attainment in Daytona Beach for adults over 25
See the full breakdown
3.0% of adults in Daytona Beach completed < 9th grade.
6.0% of adults in Daytona Beach completed 9-12th grade.
31.0% of adults in Daytona Beach completed high school / ged.
22.0% of adults in Daytona Beach completed some college.
10.0% of adults in Daytona Beach completed associate's degree.
19.0% of adults in Daytona Beach completed bachelor's degree.
6.0% of adults in Daytona Beach completed master's degree.
2.0% of adults in Daytona Beach completed professional degree.
1.0% of adults in Daytona Beach completed doctorate degree.
| Education | Daytona Beach | FL | USA |
|---|---|---|---|
| < 9th Grade | 3.0% | 5.0% | 4.0% |
| 9-12th Grade | 6.0% | 6.0% | 6.0% |
| High School / GED | 31.0% | 27.0% | 26.0% |
| Some College | 22.0% | 19.0% | 19.0% |
| Associate's Degree | 10.0% | 10.0% | 9.0% |
| Bachelor's Degree | 19.0% | 21.0% | 22.0% |
| Master's Degree | 6.0% | 9.0% | 10.0% |
| Professional Degree | 2.0% | 2.0% | 2.0% |
| Doctorate Degree | 1.0% | 1.0% | 2.0% |
Household Income For Daytona Beach, Florida
See the full breakdown
7.9% of households in Daytona Beach earn Less than $10,000.
5.2% of households in Daytona Beach earn $10,000 to $14,999.
9.2% of households in Daytona Beach earn $15,000 to $24,999.
11.1% of households in Daytona Beach earn $25,000 to $34,999.
14.4% of households in Daytona Beach earn $35,000 to $49,999.
18.5% of households in Daytona Beach earn $50,000 to $74,999.
14.3% of households in Daytona Beach earn $75,000 to $99,999.
11.3% of households in Daytona Beach earn $100,000 to $149,999.
3.8% of households in Daytona Beach earn $150,000 to $199,999.
4.3% of households in Daytona Beach earn $200,000 or more.
| Income | Daytona Beach | FL | USA |
|---|---|---|---|
| Less than $10,000 | 7.9% | 5.1% | 5.0% |
| $10,000 to $14,999 | 5.2% | 3.3% | 3.4% |
| $15,000 to $24,999 | 9.2% | 6.6% | 6.3% |
| $25,000 to $34,999 | 11.1% | 7.3% | 6.6% |
| $35,000 to $49,999 | 14.4% | 11.1% | 10.1% |
| $50,000 to $74,999 | 18.5% | 16.8% | 15.5% |
| $75,000 to $99,999 | 14.3% | 13.1% | 12.6% |
| $100,000 to $149,999 | 11.3% | 17.2% | 17.5% |
| $150,000 to $199,999 | 3.8% | 8.4% | 9.6% |
| $200,000 or more | 4.3% | 11.0% | 13.4% |
Source: U.S. Census ACS 5-year estimates (2024)


