Fort Pierce SnackAbility
Overall SnackAbility
Crime in Fort Pierce summary. We use data from the FBI to determine the crime rates in Fort Pierce. Key points include:
There were 1,207 total crimes in Fort Pierce in the last reporting year.
The overall crime rate per 100,000 people in Fort Pierce is 2,474.3 / 100k people.
The violent crime rate per 100,000 people in Fort Pierce is 541.2 / 100k people.
The property crime rate per 100,000 people in Fort Pierce is 1,933.1 / 100k people.
Overall, crime in Fort Pierce is 16.76% above the national average.
Total Crimes
Above National Average
Crime In Fort Pierce Comparison Table
| Statistic | Count Raw |
Fort Pierce / 100k People |
Florida / 100k People |
National / 100k People |
|---|---|---|---|---|
| Total Crimes Per 100K | 1,207 | 2,474.3 | 1,687.5 | 2,119.2 |
| Violent Crime | 264 | 541.2 | 267.1 | 359.0 |
| Murder | 12 | 24.6 | 3.9 | 5.0 |
| Robbery | 25 | 51.2 | 38.2 | 61.0 |
| Aggravated Assault | 215 | 440.7 | 197.1 | 256.0 |
| Property Crime | 943 | 1,933.1 | 1,420.4 | 1,760.0 |
| Burglary | 99 | 202.9 | 152.5 | 229.0 |
| Larceny | 728 | 1,492.4 | 1,144.9 | 1,272.0 |
| Car Theft | 116 | 237.8 | 123.0 | 259.0 |
Source: FBI Uniform Crime Reporting (2024)
Cost of living in Fort Pierce summary. We use data on the cost of living to determine how expensive it is to live in Fort Pierce. Real estate prices drive most of the variance in cost of living around Florida. Key points include:
The cost of living in Fort Pierce is 98 with 100 being average.
The cost of living in Fort Pierce is 1.0x lower than the national average.
The median home value in Fort Pierce is $277,925.
The median income in Fort Pierce is $47,072.
Fort Pierce's Overall Cost Of Living
Lower Than The National Average
Cost Of Living In Fort Pierce Comparison Table
| Living Expense | Fort Pierce | Florida | National Average |
|---|---|---|---|
| Overall | 98 | 104 | 100 |
| Services | 105 | 101 | 100 |
| Groceries | 105 | 105 | 100 |
| Health | 77 | 99 | 100 |
| Housing | 105 | 104 | 100 |
| Transportation | 110 | 109 | 100 |
| Utilities | 106 | 105 | 100 |
Source: Cost of living index, normalized to US average = 100
Fort Pierce, FL Weather
The average high in Fort Pierce is 82.6° and the average low is 64.0°.
There are 77.4 days of precipitation each year.
Expect an average of 53.4 inches of precipitation each year with 0.0 inches of snow.
| Stat | Fort Pierce |
|---|---|
| Average Annual High | 82.6 |
| Average Annual Low | 64.0 |
| Annual Precipitation Days | 77.4 |
| Average Annual Precipitation | 53.4 |
| Average Annual Snowfall | 0.0 |
Average High
Days of Rain
Source: NOAA climate normals (30-year)
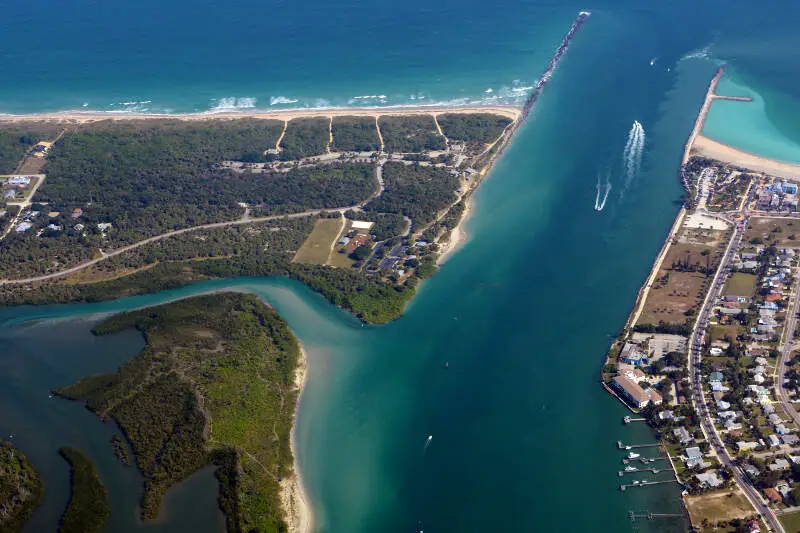
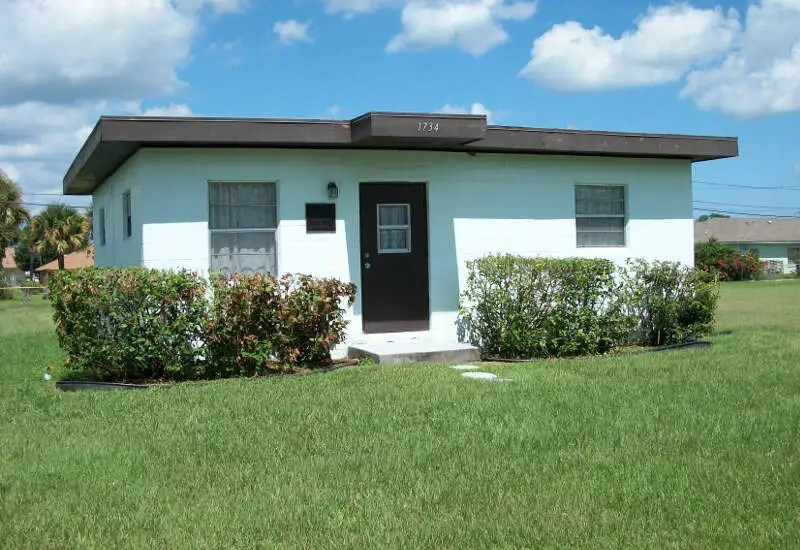
Fort Pierce, FL Photos
5 Reviews & Comments About Fort Pierce

I live in Fort Pierce born and raised and over the last 15-20 years I have listened to kids who are not even old enough to know when Fort Pierce use to be bad,some of them wasn't even born yet but yet they can say how bad Fort Pierce is and most of them has never even stepped foot in Fort Pierce other than going to the beaches we have.
If they think Fort Pierce is so bad then don't come to our beaches.. but yet Fort Pierce residents can't even get on our beaches in the summertime because everybody from other cities is flooding our beaches.
They come from all around to get to those beautiful Fort Pierce beaches and then they go back to where they live and talk about how terrible Fort Pierce is and they never experienced anything in Fort Pierce to the negative.
I was born in Hollywood Florida, raised in South Florida. So I'm a native. Currently living in Fort Pierce. Stuck here for now, the police some are good and some are just thugs bad seeds! I went down two weeks ago about an officer abusing his power in regards to free speech, the Sargent I spoke too understand my position on the law and even admitted that the city ordinance was very vague. He said he would talk with this officer and everything was fine with this one. So two weeks later another officer treated me and threaten me of incarceration. So I went down again to speak with a supervisor this time with a different result! She claimed that they were govern by city ordinance, since when the government govern themselves- I always believed they were govern by the checks and balances of the Constitution-----
I live in Fort Pierce.... Yeah there is a part of the neighborhood that is bad, and that's where most of the unemployment rate comes from. We also have a lot of immigrants who run lawn service as income. Out class ratio in most St Lucie classes is at most 32. I have went to a school in Kentucky that had 42 students all crammed in a small room and one teacher, we did fine though. I've lived in Fort Pierce for almost 4 years, I did have a bike stolen once, though it was after riding it for several years. The worse part of Fort Pierce is drivers. I ride a bike and smiles close to getting hit a lot even when having the right of way.
Fort Pierce!!! I live in fort pierce it really isn't that bad
The young people needs jobs and things to do on weekends and summer. The city need to do more emforstucture by getting more federal funds.
Expand the waterfront and move the boats out from the land mark. Bring in more weekend entrainment to get more revenue.
Rankings & Articles For Fort Pierce


Locations Around Fort Pierce
Map Of Fort Pierce, FL
Best Places Around Fort Pierce
Jensen Beach, FL
Population 12,531
Vero Beach South, FL
Population 30,344
Stuart, FL
Population 18,520
Florida Ridge, FL
Population 20,889
Port St. Lucie, FL
Population 232,491
Vero Beach, FL
Population 17,042
Lakewood Park, FL
Population 13,866
Fort Pierce Demographics And Statistics
Population over time in Fort Pierce
The current population in Fort Pierce is 49,082. The population has increased 15.5% from 2010.
| Year | Population | % Change |
|---|---|---|
| 2024 | 49,082 | 2.1% |
| 2023 | 48,094 | 2.0% |
| 2022 | 47,153 | 1.6% |
| 2021 | 46,409 | 1.2% |
| 2020 | 45,855 | 1.2% |
| 2019 | 45,329 | 1.1% |
| 2018 | 44,833 | 1.3% |
| 2017 | 44,248 | 0.8% |
| 2016 | 43,883 | 1.4% |
| 2015 | 43,267 | 1.2% |
| 2014 | 42,744 | 0.8% |
| 2013 | 42,395 | 0.1% |
| 2012 | 42,350 | -0.1% |
| 2011 | 42,373 | -0.2% |
| 2010 | 42,478 | - |
Race / Ethnicity in Fort Pierce
See the full breakdown
Fort Pierce is:
30.3% White with 14,888 White residents.
43.5% African American with 21,337 African American residents.
0.1% American Indian with 58 American Indian residents.
2.1% Asian with 1,015 Asian residents.
0.0% Hawaiian with 0 Hawaiian residents.
0.5% Other with 245 Other residents.
2.9% Two Or More with 1,404 Two Or More residents.
20.6% Hispanic with 10,135 Hispanic residents.
| Race | Fort Pierce | FL | USA |
|---|---|---|---|
| White | 30.3% | 50.4% | 57.4% |
| African American | 43.5% | 14.6% | 11.9% |
| American Indian | 0.1% | 0.1% | 0.5% |
| Asian | 2.1% | 2.9% | 5.9% |
| Hawaiian | 0.0% | 0.1% | 0.2% |
| Other | 0.5% | 0.7% | 0.6% |
| Two Or More | 2.9% | 3.8% | 4.3% |
| Hispanic | 20.6% | 27.4% | 19.3% |
Gender in Fort Pierce
See the full breakdown
Fort Pierce is 52.6% female with 25,830 female residents.
Fort Pierce is 47.4% male with 23,252 male residents.
| Gender | Fort Pierce | FL | USA |
|---|---|---|---|
| Female | 52.6% | 50.9% | 50.5% |
| Male | 47.4% | 49.1% | 49.5% |
Highest level of educational attainment in Fort Pierce for adults over 25
See the full breakdown
10.0% of adults in Fort Pierce completed < 9th grade.
13.0% of adults in Fort Pierce completed 9-12th grade.
28.0% of adults in Fort Pierce completed high school / ged.
19.0% of adults in Fort Pierce completed some college.
12.0% of adults in Fort Pierce completed associate's degree.
11.0% of adults in Fort Pierce completed bachelor's degree.
5.0% of adults in Fort Pierce completed master's degree.
1.0% of adults in Fort Pierce completed professional degree.
1.0% of adults in Fort Pierce completed doctorate degree.
| Education | Fort Pierce | FL | USA |
|---|---|---|---|
| < 9th Grade | 10.0% | 5.0% | 4.0% |
| 9-12th Grade | 13.0% | 6.0% | 6.0% |
| High School / GED | 28.0% | 27.0% | 26.0% |
| Some College | 19.0% | 19.0% | 19.0% |
| Associate's Degree | 12.0% | 10.0% | 9.0% |
| Bachelor's Degree | 11.0% | 21.0% | 22.0% |
| Master's Degree | 5.0% | 9.0% | 10.0% |
| Professional Degree | 1.0% | 2.0% | 2.0% |
| Doctorate Degree | 1.0% | 1.0% | 2.0% |
Household Income For Fort Pierce, Florida
See the full breakdown
10.9% of households in Fort Pierce earn Less than $10,000.
5.8% of households in Fort Pierce earn $10,000 to $14,999.
11.7% of households in Fort Pierce earn $15,000 to $24,999.
12.6% of households in Fort Pierce earn $25,000 to $34,999.
11.8% of households in Fort Pierce earn $35,000 to $49,999.
19.1% of households in Fort Pierce earn $50,000 to $74,999.
11.6% of households in Fort Pierce earn $75,000 to $99,999.
10.6% of households in Fort Pierce earn $100,000 to $149,999.
2.1% of households in Fort Pierce earn $150,000 to $199,999.
3.8% of households in Fort Pierce earn $200,000 or more.
| Income | Fort Pierce | FL | USA |
|---|---|---|---|
| Less than $10,000 | 10.9% | 5.1% | 5.0% |
| $10,000 to $14,999 | 5.8% | 3.3% | 3.4% |
| $15,000 to $24,999 | 11.7% | 6.6% | 6.3% |
| $25,000 to $34,999 | 12.6% | 7.3% | 6.6% |
| $35,000 to $49,999 | 11.8% | 11.1% | 10.1% |
| $50,000 to $74,999 | 19.1% | 16.8% | 15.5% |
| $75,000 to $99,999 | 11.6% | 13.1% | 12.6% |
| $100,000 to $149,999 | 10.6% | 17.2% | 17.5% |
| $150,000 to $199,999 | 2.1% | 8.4% | 9.6% |
| $200,000 or more | 3.8% | 11.0% | 13.4% |
Source: U.S. Census ACS 5-year estimates (2024)


