Marianna SnackAbility
Overall SnackAbility
Crime in Marianna summary. We use data from the FBI to determine the crime rates in Marianna. Key points include:
There were 90 total crimes in Marianna in the last reporting year.
The overall crime rate per 100,000 people in Marianna is 1,173.4 / 100k people.
The violent crime rate per 100,000 people in Marianna is 208.6 / 100k people.
The property crime rate per 100,000 people in Marianna is 964.8 / 100k people.
Overall, crime in Marianna is -44.63% below the national average.
Total Crimes
Below National Average
Crime In Marianna Comparison Table
| Statistic | Count Raw |
Marianna / 100k People |
Florida / 100k People |
National / 100k People |
|---|---|---|---|---|
| Total Crimes Per 100K | 90 | 1,173.4 | 1,687.5 | 2,119.2 |
| Violent Crime | 16 | 208.6 | 267.1 | 359.0 |
| Murder | 0 | 0.0 | 3.9 | 5.0 |
| Robbery | 1 | 13.0 | 38.2 | 61.0 |
| Aggravated Assault | 12 | 156.5 | 197.1 | 256.0 |
| Property Crime | 74 | 964.8 | 1,420.4 | 1,760.0 |
| Burglary | 28 | 365.1 | 152.5 | 229.0 |
| Larceny | 46 | 599.7 | 1,144.9 | 1,272.0 |
| Car Theft | 0 | 0.0 | 123.0 | 259.0 |
Source: FBI Uniform Crime Reporting (2024)
Cost of living in Marianna summary. We use data on the cost of living to determine how expensive it is to live in Marianna. Real estate prices drive most of the variance in cost of living around Florida. Key points include:
The cost of living in Marianna is 82 with 100 being average.
The cost of living in Marianna is 0.8x lower than the national average.
The median home value in Marianna is $193,116.
The median income in Marianna is $40,414.
Marianna's Overall Cost Of Living
Lower Than The National Average
Cost Of Living In Marianna Comparison Table
| Living Expense | Marianna | Florida | National Average |
|---|---|---|---|
| Overall | 82 | 104 | 100 |
| Services | 95 | 101 | 100 |
| Groceries | 95 | 105 | 100 |
| Health | 55 | 99 | 100 |
| Housing | 94 | 104 | 100 |
| Transportation | 102 | 109 | 100 |
| Utilities | 90 | 105 | 100 |
Source: Cost of living index, normalized to US average = 100
Marianna, FL Weather
The average high in Marianna is 78.7° and the average low is 55.7°.
There are 81.4 days of precipitation each year.
Expect an average of 57.6 inches of precipitation each year with 0.0 inches of snow.
| Stat | Marianna |
|---|---|
| Average Annual High | 78.7 |
| Average Annual Low | 55.7 |
| Annual Precipitation Days | 81.4 |
| Average Annual Precipitation | 57.6 |
| Average Annual Snowfall | 0.0 |
Average High
Days of Rain
Source: NOAA climate normals (30-year)
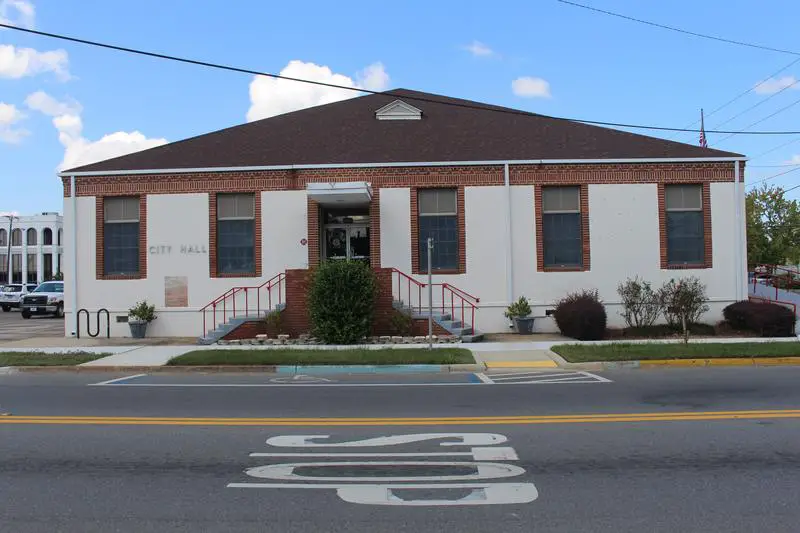
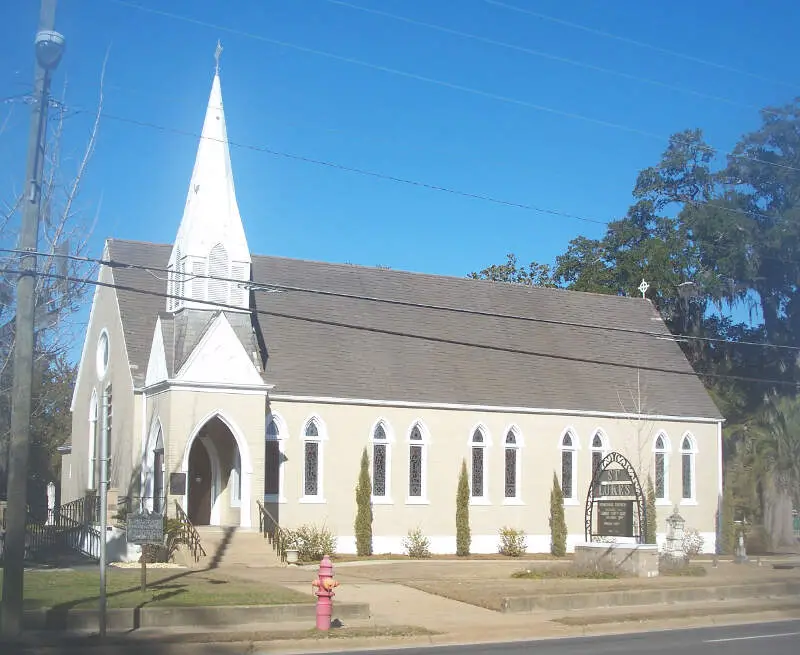
Marianna, FL Photos

1 Reviews & Comments About Marianna

Marianna is home to Florida Caverns State Park, a park built around a underground series of caves. Take a tour, you'll learn a lot and cool off from the summer heat.
Florida Caverns State Park is the highlight of time. Tour the caves, but also take a deep in the Blue Hole, a nice deep swimming whole in the park. Also enjoy the extensive hiking trails. Watch out for mosquitoes, snakes, and poison ivy, as well as drunk rednecks.
Rankings & Articles For Marianna


Locations Around Marianna
Map Of Marianna, FL
Best Places Around Marianna
Lynn Haven, FL
Population 20,081
Callaway, FL
Population 13,496
Dothan, AL
Population 71,514
Blakely, GA
Population 5,238
Bainbridge, GA
Population 14,404
Marianna Demographics And Statistics
Population over time in Marianna
The current population in Marianna is 7,150. The population has increased 15.8% from 2010.
| Year | Population | % Change |
|---|---|---|
| 2024 | 7,150 | 4.9% |
| 2023 | 6,815 | 2.0% |
| 2022 | 6,681 | 3.6% |
| 2021 | 6,446 | -2.4% |
| 2020 | 6,607 | -4.6% |
| 2019 | 6,923 | -4.7% |
| 2018 | 7,266 | -1.3% |
| 2017 | 7,360 | -19.6% |
| 2016 | 9,157 | 3.4% |
| 2015 | 8,860 | 3.6% |
| 2014 | 8,548 | 7.7% |
| 2013 | 7,939 | 8.3% |
| 2012 | 7,330 | 19.3% |
| 2011 | 6,143 | -0.5% |
| 2010 | 6,172 | - |
Race / Ethnicity in Marianna
See the full breakdown
Marianna is:
43.8% White with 3,135 White residents.
44.2% African American with 3,161 African American residents.
0.5% American Indian with 36 American Indian residents.
0.6% Asian with 45 Asian residents.
0.0% Hawaiian with 0 Hawaiian residents.
0.4% Other with 29 Other residents.
3.5% Two Or More with 251 Two Or More residents.
6.9% Hispanic with 493 Hispanic residents.
| Race | Marianna | FL | USA |
|---|---|---|---|
| White | 43.8% | 50.4% | 57.4% |
| African American | 44.2% | 14.6% | 11.9% |
| American Indian | 0.5% | 0.1% | 0.5% |
| Asian | 0.6% | 2.9% | 5.9% |
| Hawaiian | 0.0% | 0.1% | 0.2% |
| Other | 0.4% | 0.7% | 0.6% |
| Two Or More | 3.5% | 3.8% | 4.3% |
| Hispanic | 6.9% | 27.4% | 19.3% |
Gender in Marianna
See the full breakdown
Marianna is 53.1% female with 3,796 female residents.
Marianna is 46.9% male with 3,353 male residents.
| Gender | Marianna | FL | USA |
|---|---|---|---|
| Female | 53.1% | 50.9% | 50.5% |
| Male | 46.9% | 49.1% | 49.5% |
Highest level of educational attainment in Marianna for adults over 25
See the full breakdown
6.0% of adults in Marianna completed < 9th grade.
8.0% of adults in Marianna completed 9-12th grade.
39.0% of adults in Marianna completed high school / ged.
22.0% of adults in Marianna completed some college.
11.0% of adults in Marianna completed associate's degree.
8.0% of adults in Marianna completed bachelor's degree.
5.0% of adults in Marianna completed master's degree.
1.0% of adults in Marianna completed professional degree.
0.0% of adults in Marianna completed doctorate degree.
| Education | Marianna | FL | USA |
|---|---|---|---|
| < 9th Grade | 6.0% | 5.0% | 4.0% |
| 9-12th Grade | 8.0% | 6.0% | 6.0% |
| High School / GED | 39.0% | 27.0% | 26.0% |
| Some College | 22.0% | 19.0% | 19.0% |
| Associate's Degree | 11.0% | 10.0% | 9.0% |
| Bachelor's Degree | 8.0% | 21.0% | 22.0% |
| Master's Degree | 5.0% | 9.0% | 10.0% |
| Professional Degree | 1.0% | 2.0% | 2.0% |
| Doctorate Degree | 0.0% | 1.0% | 2.0% |
Household Income For Marianna, Florida
See the full breakdown
8.2% of households in Marianna earn Less than $10,000.
4.3% of households in Marianna earn $10,000 to $14,999.
13.9% of households in Marianna earn $15,000 to $24,999.
16.3% of households in Marianna earn $25,000 to $34,999.
14.8% of households in Marianna earn $35,000 to $49,999.
20.6% of households in Marianna earn $50,000 to $74,999.
17.1% of households in Marianna earn $75,000 to $99,999.
4.0% of households in Marianna earn $100,000 to $149,999.
0.0% of households in Marianna earn $150,000 to $199,999.
0.8% of households in Marianna earn $200,000 or more.
| Income | Marianna | FL | USA |
|---|---|---|---|
| Less than $10,000 | 8.2% | 5.1% | 5.0% |
| $10,000 to $14,999 | 4.3% | 3.3% | 3.4% |
| $15,000 to $24,999 | 13.9% | 6.6% | 6.3% |
| $25,000 to $34,999 | 16.3% | 7.3% | 6.6% |
| $35,000 to $49,999 | 14.8% | 11.1% | 10.1% |
| $50,000 to $74,999 | 20.6% | 16.8% | 15.5% |
| $75,000 to $99,999 | 17.1% | 13.1% | 12.6% |
| $100,000 to $149,999 | 4.0% | 17.2% | 17.5% |
| $150,000 to $199,999 | 0.0% | 8.4% | 9.6% |
| $200,000 or more | 0.8% | 11.0% | 13.4% |
Source: U.S. Census ACS 5-year estimates (2024)


