Ocala SnackAbility
Overall SnackAbility
Crime in Ocala summary. We use data from the FBI to determine the crime rates in Ocala. Key points include:
There were 2,486 total crimes in Ocala in the last reporting year.
The overall crime rate per 100,000 people in Ocala is 3,549.1 / 100k people.
The violent crime rate per 100,000 people in Ocala is 499.7 / 100k people.
The property crime rate per 100,000 people in Ocala is 3,049.4 / 100k people.
Overall, crime in Ocala is 67.47% above the national average.
Total Crimes
Above National Average
Crime In Ocala Comparison Table
| Statistic | Count Raw |
Ocala / 100k People |
Florida / 100k People |
National / 100k People |
|---|---|---|---|---|
| Total Crimes Per 100K | 2,486 | 3,549.1 | 1,687.5 | 2,119.2 |
| Violent Crime | 350 | 499.7 | 267.1 | 359.0 |
| Murder | 5 | 7.1 | 3.9 | 5.0 |
| Robbery | 41 | 58.5 | 38.2 | 61.0 |
| Aggravated Assault | 270 | 385.5 | 197.1 | 256.0 |
| Property Crime | 2,136 | 3,049.4 | 1,420.4 | 1,760.0 |
| Burglary | 192 | 274.1 | 152.5 | 229.0 |
| Larceny | 1,921 | 2,742.5 | 1,144.9 | 1,272.0 |
| Car Theft | 23 | 32.8 | 123.0 | 259.0 |
Source: FBI Uniform Crime Reporting (2024)
Cost of living in Ocala summary. We use data on the cost of living to determine how expensive it is to live in Ocala. Real estate prices drive most of the variance in cost of living around Florida. Key points include:
The cost of living in Ocala is 100 with 100 being average.
The cost of living in Ocala is 1.0x lower than the national average.
The median home value in Ocala is $269,576.
The median income in Ocala is $56,376.
Ocala's Overall Cost Of Living
Lower Than The National Average
Cost Of Living In Ocala Comparison Table
| Living Expense | Ocala | Florida | National Average |
|---|---|---|---|
| Overall | 100 | 104 | 100 |
| Services | 105 | 101 | 100 |
| Groceries | 104 | 105 | 100 |
| Health | 86 | 99 | 100 |
| Housing | 98 | 104 | 100 |
| Transportation | 111 | 109 | 100 |
| Utilities | 101 | 105 | 100 |
Source: Cost of living index, normalized to US average = 100
Ocala, FL Weather
The average high in Ocala is 81.8° and the average low is 58.5°.
There are 76.3 days of precipitation each year.
Expect an average of 51.0 inches of precipitation each year with 0.0 inches of snow.
| Stat | Ocala |
|---|---|
| Average Annual High | 81.8 |
| Average Annual Low | 58.5 |
| Annual Precipitation Days | 76.3 |
| Average Annual Precipitation | 51.0 |
| Average Annual Snowfall | 0.0 |
Average High
Days of Rain
Source: NOAA climate normals (30-year)
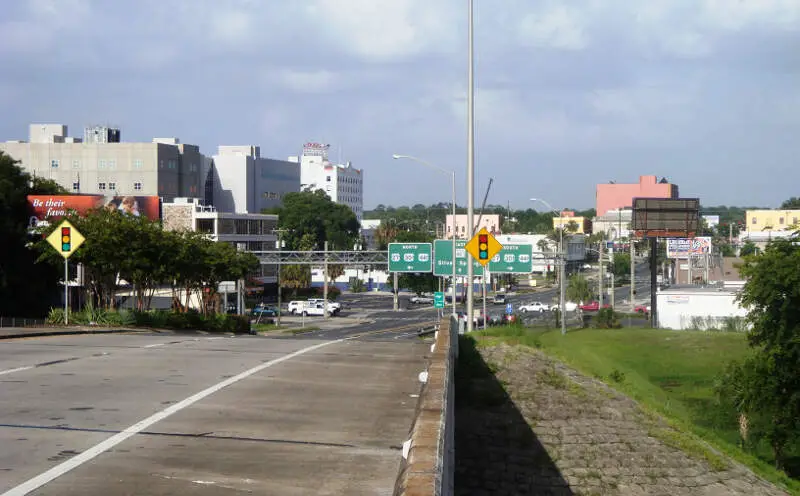
Ocala, FL Photos


Rankings & Articles For Ocala


Locations Around Ocala
Map Of Ocala, FL
Best Places Around Ocala
The Villages, FL
Population 83,498
Apopka, FL
Population 58,232
Gainesville, FL
Population 145,702
Tavares, FL
Population 20,463
Lady Lake, FL
Population 16,675
Clermont, FL
Population 46,853
Eustis, FL
Population 24,119
Leesburg, FL
Population 30,807
Homosassa Springs, FL
Population 15,701
Mount Dora, FL
Population 17,278
Ocala Demographics And Statistics
Population over time in Ocala
The current population in Ocala is 66,584. The population has increased 18.8% from 2010.
| Year | Population | % Change |
|---|---|---|
| 2024 | 66,584 | 2.6% |
| 2023 | 64,903 | 2.2% |
| 2022 | 63,504 | 1.8% |
| 2021 | 62,351 | 3.9% |
| 2020 | 60,021 | 1.3% |
| 2019 | 59,267 | 1.1% |
| 2018 | 58,598 | 1.4% |
| 2017 | 57,812 | -0.1% |
| 2016 | 57,873 | 1.2% |
| 2015 | 57,209 | 0.5% |
| 2014 | 56,918 | 0.2% |
| 2013 | 56,828 | 0.4% |
| 2012 | 56,598 | 0.4% |
| 2011 | 56,376 | 0.6% |
| 2010 | 56,051 | - |
Race / Ethnicity in Ocala
See the full breakdown
Ocala is:
56.5% White with 37,634 White residents.
17.6% African American with 11,720 African American residents.
0.1% American Indian with 52 American Indian residents.
4.0% Asian with 2,681 Asian residents.
0.0% Hawaiian with 6 Hawaiian residents.
0.4% Other with 287 Other residents.
3.5% Two Or More with 2,362 Two Or More residents.
17.8% Hispanic with 11,842 Hispanic residents.
| Race | Ocala | FL | USA |
|---|---|---|---|
| White | 56.5% | 50.4% | 57.4% |
| African American | 17.6% | 14.6% | 11.9% |
| American Indian | 0.1% | 0.1% | 0.5% |
| Asian | 4.0% | 2.9% | 5.9% |
| Hawaiian | 0.0% | 0.1% | 0.2% |
| Other | 0.4% | 0.7% | 0.6% |
| Two Or More | 3.5% | 3.8% | 4.3% |
| Hispanic | 17.8% | 27.4% | 19.3% |
Gender in Ocala
See the full breakdown
Ocala is 52.8% female with 35,163 female residents.
Ocala is 47.2% male with 31,421 male residents.
| Gender | Ocala | FL | USA |
|---|---|---|---|
| Female | 52.8% | 50.9% | 50.5% |
| Male | 47.2% | 49.1% | 49.5% |
Highest level of educational attainment in Ocala for adults over 25
See the full breakdown
3.0% of adults in Ocala completed < 9th grade.
6.0% of adults in Ocala completed 9-12th grade.
28.0% of adults in Ocala completed high school / ged.
22.0% of adults in Ocala completed some college.
10.0% of adults in Ocala completed associate's degree.
20.0% of adults in Ocala completed bachelor's degree.
8.0% of adults in Ocala completed master's degree.
2.0% of adults in Ocala completed professional degree.
1.0% of adults in Ocala completed doctorate degree.
| Education | Ocala | FL | USA |
|---|---|---|---|
| < 9th Grade | 3.0% | 5.0% | 4.0% |
| 9-12th Grade | 6.0% | 6.0% | 6.0% |
| High School / GED | 28.0% | 27.0% | 26.0% |
| Some College | 22.0% | 19.0% | 19.0% |
| Associate's Degree | 10.0% | 10.0% | 9.0% |
| Bachelor's Degree | 20.0% | 21.0% | 22.0% |
| Master's Degree | 8.0% | 9.0% | 10.0% |
| Professional Degree | 2.0% | 2.0% | 2.0% |
| Doctorate Degree | 1.0% | 1.0% | 2.0% |
Household Income For Ocala, Florida
See the full breakdown
7.8% of households in Ocala earn Less than $10,000.
4.5% of households in Ocala earn $10,000 to $14,999.
9.4% of households in Ocala earn $15,000 to $24,999.
10.8% of households in Ocala earn $25,000 to $34,999.
13.3% of households in Ocala earn $35,000 to $49,999.
16.0% of households in Ocala earn $50,000 to $74,999.
14.1% of households in Ocala earn $75,000 to $99,999.
14.2% of households in Ocala earn $100,000 to $149,999.
4.4% of households in Ocala earn $150,000 to $199,999.
5.5% of households in Ocala earn $200,000 or more.
| Income | Ocala | FL | USA |
|---|---|---|---|
| Less than $10,000 | 7.8% | 5.1% | 5.0% |
| $10,000 to $14,999 | 4.5% | 3.3% | 3.4% |
| $15,000 to $24,999 | 9.4% | 6.6% | 6.3% |
| $25,000 to $34,999 | 10.8% | 7.3% | 6.6% |
| $35,000 to $49,999 | 13.3% | 11.1% | 10.1% |
| $50,000 to $74,999 | 16.0% | 16.8% | 15.5% |
| $75,000 to $99,999 | 14.1% | 13.1% | 12.6% |
| $100,000 to $149,999 | 14.2% | 17.2% | 17.5% |
| $150,000 to $199,999 | 4.4% | 8.4% | 9.6% |
| $200,000 or more | 5.5% | 11.0% | 13.4% |
Source: U.S. Census ACS 5-year estimates (2024)


