Compare Pensacola to…
Pensacola SnackAbility
Overall SnackAbility
Crime in Pensacola summary. We use data from the FBI to determine the crime rates in Pensacola. Key points include:
There were 668 total crimes in Pensacola in the last reporting year.
The overall crime rate per 100,000 people in Pensacola is 1,246.7 / 100k people.
The violent crime rate per 100,000 people in Pensacola is 130.6 / 100k people.
The property crime rate per 100,000 people in Pensacola is 1,116.0 / 100k people.
Overall, crime in Pensacola is -41.17% below the national average.
Total Crimes
Below National Average
Crime In Pensacola Comparison Table
| Statistic | Count Raw |
Pensacola / 100k People |
Florida / 100k People |
National / 100k People |
|---|---|---|---|---|
| Total Crimes Per 100K | 668 | 1,246.7 | 1,687.5 | 2,119.2 |
| Violent Crime | 70 | 130.6 | 267.1 | 359.0 |
| Murder | 1 | 1.9 | 3.9 | 5.0 |
| Robbery | 0 | 0.0 | 38.2 | 61.0 |
| Aggravated Assault | 54 | 100.8 | 197.1 | 256.0 |
| Property Crime | 598 | 1,116.0 | 1,420.4 | 1,760.0 |
| Burglary | 6 | 11.2 | 152.5 | 229.0 |
| Larceny | 577 | 1,076.8 | 1,144.9 | 1,272.0 |
| Car Theft | 15 | 28.0 | 123.0 | 259.0 |
Source: FBI Uniform Crime Reporting (2024)
Cost of living in Pensacola summary. We use data on the cost of living to determine how expensive it is to live in Pensacola. Real estate prices drive most of the variance in cost of living around Florida. Key points include:
The cost of living in Pensacola is 107 with 100 being average.
The cost of living in Pensacola is 1.1x higher than the national average.
The median home value in Pensacola is $265,791.
The median income in Pensacola is $74,212.
Pensacola's Overall Cost Of Living
Higher Than The National Average
Cost Of Living In Pensacola Comparison Table
| Living Expense | Pensacola | Florida | National Average |
|---|---|---|---|
| Overall | 107 | 104 | 100 |
| Services | 99 | 101 | 100 |
| Groceries | 105 | 105 | 100 |
| Health | 110 | 99 | 100 |
| Housing | 106 | 104 | 100 |
| Transportation | 112 | 109 | 100 |
| Utilities | 103 | 105 | 100 |
Source: Cost of living index, normalized to US average = 100
Pensacola, FL Weather
The average high in Pensacola is 76.8° and the average low is 59.1°.
There are 77.2 days of precipitation each year.
Expect an average of 66.4 inches of precipitation each year with 0.0 inches of snow.
| Stat | Pensacola |
|---|---|
| Average Annual High | 76.8 |
| Average Annual Low | 59.1 |
| Annual Precipitation Days | 77.2 |
| Average Annual Precipitation | 66.4 |
| Average Annual Snowfall | 0.0 |
Average High
Days of Rain
Source: NOAA climate normals (30-year)
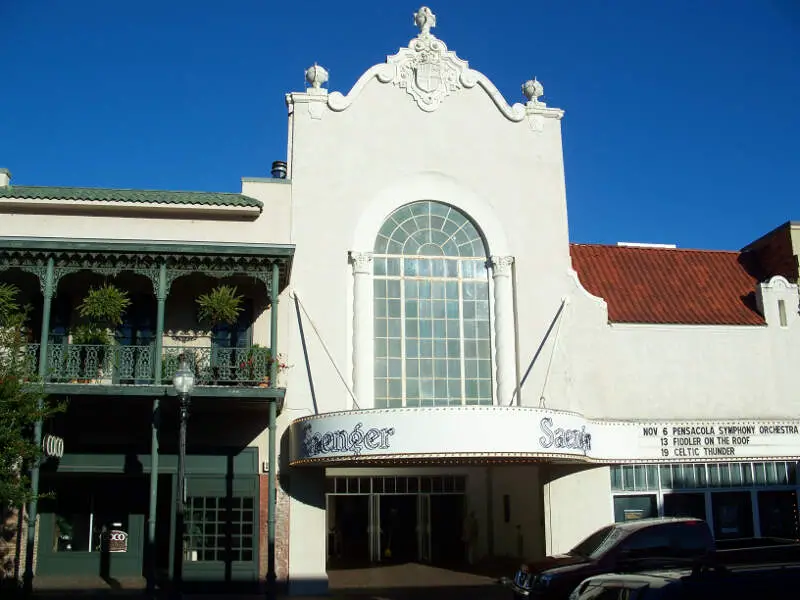
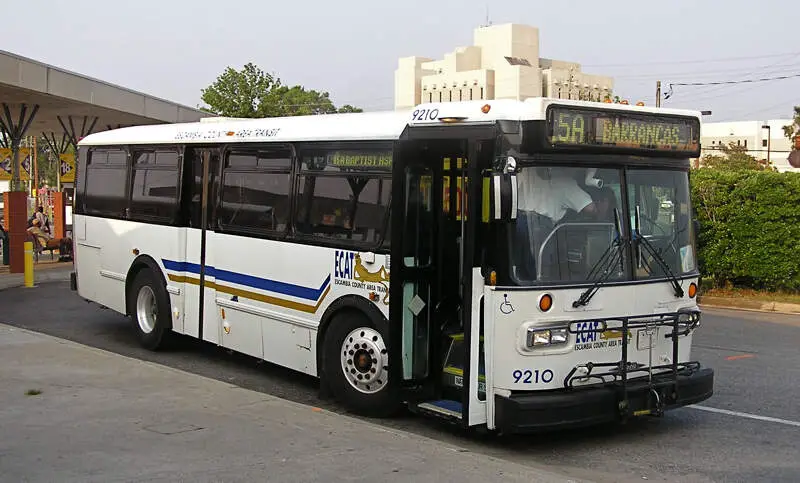
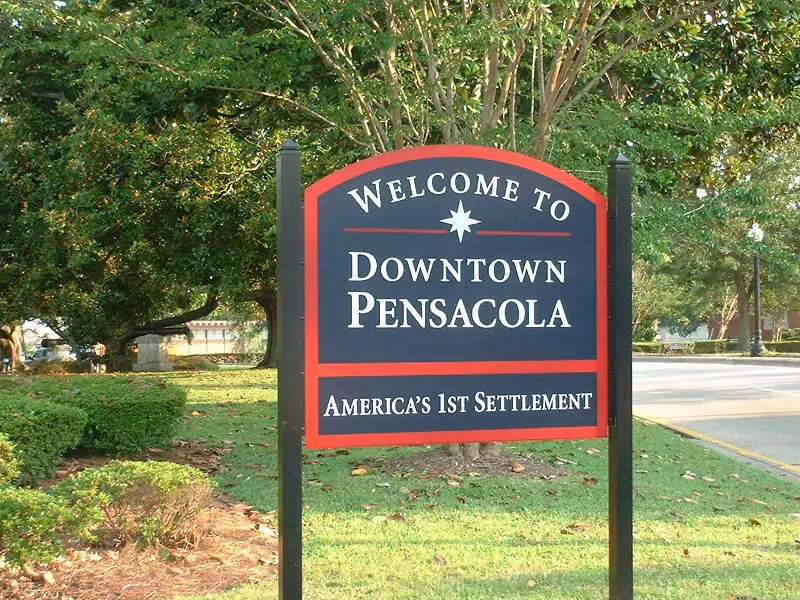
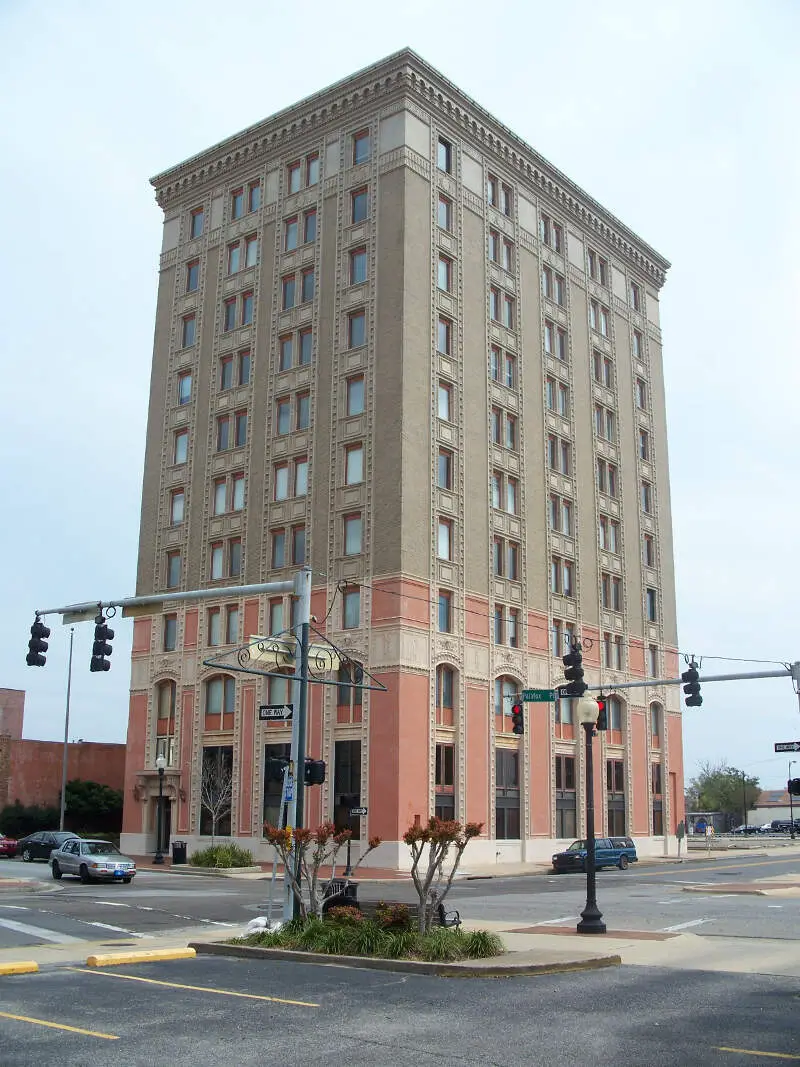
Pensacola, FL Photos


1 Reviews & Comments About Pensacola

I live in Pensacola and people leave that town due to crime
Rankings & Articles For Pensacola


Locations Around Pensacola
Map Of Pensacola, FL
Best Places Around Pensacola
Gonzalez, FL
Population 14,458
Pace, FL
Population 26,282
Navarre, FL
Population 39,838
Bellview, FL
Population 26,488
Myrtle Grove, FL
Population 15,595
Ferry Pass, FL
Population 30,053
Ensley, FL
Population 23,760
Brent, FL
Population 23,813
West Pensacola, FL
Population 20,665
Warrington, FL
Population 15,918
Pensacola Demographics And Statistics
Population over time in Pensacola
The current population in Pensacola is 54,036. The population has increased 2.1% from 2010.
| Year | Population | % Change |
|---|---|---|
| 2024 | 54,036 | 0.0% |
| 2023 | 54,011 | -0.1% |
| 2022 | 54,059 | 0.4% |
| 2021 | 53,845 | 1.8% |
| 2020 | 52,918 | 0.5% |
| 2019 | 52,642 | 0.2% |
| 2018 | 52,562 | -0.2% |
| 2017 | 52,689 | -1.1% |
| 2016 | 53,250 | 0.9% |
| 2015 | 52,752 | 0.5% |
| 2014 | 52,505 | 0.5% |
| 2013 | 52,268 | 0.0% |
| 2012 | 52,246 | -0.4% |
| 2011 | 52,482 | -0.8% |
| 2010 | 52,903 | - |
Race / Ethnicity in Pensacola
See the full breakdown
Pensacola is:
64.9% White with 35,085 White residents.
20.7% African American with 11,187 African American residents.
0.1% American Indian with 37 American Indian residents.
2.7% Asian with 1,445 Asian residents.
0.1% Hawaiian with 52 Hawaiian residents.
0.4% Other with 210 Other residents.
6.2% Two Or More with 3,333 Two Or More residents.
5.0% Hispanic with 2,687 Hispanic residents.
| Race | Pensacola | FL | USA |
|---|---|---|---|
| White | 64.9% | 50.4% | 57.4% |
| African American | 20.7% | 14.6% | 11.9% |
| American Indian | 0.1% | 0.1% | 0.5% |
| Asian | 2.7% | 2.9% | 5.9% |
| Hawaiian | 0.1% | 0.1% | 0.2% |
| Other | 0.4% | 0.7% | 0.6% |
| Two Or More | 6.2% | 3.8% | 4.3% |
| Hispanic | 5.0% | 27.4% | 19.3% |
Gender in Pensacola
See the full breakdown
Pensacola is 52.3% female with 28,266 female residents.
Pensacola is 47.7% male with 25,769 male residents.
| Gender | Pensacola | FL | USA |
|---|---|---|---|
| Female | 52.3% | 50.9% | 50.5% |
| Male | 47.7% | 49.1% | 49.5% |
Highest level of educational attainment in Pensacola for adults over 25
See the full breakdown
1.0% of adults in Pensacola completed < 9th grade.
6.0% of adults in Pensacola completed 9-12th grade.
20.0% of adults in Pensacola completed high school / ged.
21.0% of adults in Pensacola completed some college.
9.0% of adults in Pensacola completed associate's degree.
25.0% of adults in Pensacola completed bachelor's degree.
11.0% of adults in Pensacola completed master's degree.
4.0% of adults in Pensacola completed professional degree.
3.0% of adults in Pensacola completed doctorate degree.
| Education | Pensacola | FL | USA |
|---|---|---|---|
| < 9th Grade | 1.0% | 5.0% | 4.0% |
| 9-12th Grade | 6.0% | 6.0% | 6.0% |
| High School / GED | 20.0% | 27.0% | 26.0% |
| Some College | 21.0% | 19.0% | 19.0% |
| Associate's Degree | 9.0% | 10.0% | 9.0% |
| Bachelor's Degree | 25.0% | 21.0% | 22.0% |
| Master's Degree | 11.0% | 9.0% | 10.0% |
| Professional Degree | 4.0% | 2.0% | 2.0% |
| Doctorate Degree | 3.0% | 1.0% | 2.0% |
Household Income For Pensacola, Florida
See the full breakdown
5.5% of households in Pensacola earn Less than $10,000.
4.4% of households in Pensacola earn $10,000 to $14,999.
6.8% of households in Pensacola earn $15,000 to $24,999.
7.0% of households in Pensacola earn $25,000 to $34,999.
11.3% of households in Pensacola earn $35,000 to $49,999.
15.7% of households in Pensacola earn $50,000 to $74,999.
11.5% of households in Pensacola earn $75,000 to $99,999.
18.8% of households in Pensacola earn $100,000 to $149,999.
8.1% of households in Pensacola earn $150,000 to $199,999.
10.9% of households in Pensacola earn $200,000 or more.
| Income | Pensacola | FL | USA |
|---|---|---|---|
| Less than $10,000 | 5.5% | 5.1% | 5.0% |
| $10,000 to $14,999 | 4.4% | 3.3% | 3.4% |
| $15,000 to $24,999 | 6.8% | 6.6% | 6.3% |
| $25,000 to $34,999 | 7.0% | 7.3% | 6.6% |
| $35,000 to $49,999 | 11.3% | 11.1% | 10.1% |
| $50,000 to $74,999 | 15.7% | 16.8% | 15.5% |
| $75,000 to $99,999 | 11.5% | 13.1% | 12.6% |
| $100,000 to $149,999 | 18.8% | 17.2% | 17.5% |
| $150,000 to $199,999 | 8.1% | 8.4% | 9.6% |
| $200,000 or more | 10.9% | 11.0% | 13.4% |
Source: U.S. Census ACS 5-year estimates (2024)


