Safety Harbor SnackAbility
Overall SnackAbility
Crime in Safety Harbor summary. We use data from the FBI to determine the crime rates in Safety Harbor. Key points include:
There were 139 total crimes in Safety Harbor in the last reporting year.
The overall crime rate per 100,000 people in Safety Harbor is 821.3 / 100k people.
The violent crime rate per 100,000 people in Safety Harbor is 130.0 / 100k people.
The property crime rate per 100,000 people in Safety Harbor is 691.3 / 100k people.
Overall, crime in Safety Harbor is -61.24% below the national average.
Total Crimes
Below National Average
Crime In Safety Harbor Comparison Table
| Statistic | Count Raw |
Safety Harbor / 100k People |
Florida / 100k People |
National / 100k People |
|---|---|---|---|---|
| Total Crimes Per 100K | 139 | 821.3 | 1,687.5 | 2,119.2 |
| Violent Crime | 22 | 130.0 | 267.1 | 359.0 |
| Murder | 0 | 0.0 | 3.9 | 5.0 |
| Robbery | 4 | 23.6 | 38.2 | 61.0 |
| Aggravated Assault | 13 | 76.8 | 197.1 | 256.0 |
| Property Crime | 117 | 691.3 | 1,420.4 | 1,760.0 |
| Burglary | 16 | 94.5 | 152.5 | 229.0 |
| Larceny | 94 | 555.4 | 1,144.9 | 1,272.0 |
| Car Theft | 7 | 41.4 | 123.0 | 259.0 |
Source: FBI Uniform Crime Reporting (2024)
Cost of living in Safety Harbor summary. We use data on the cost of living to determine how expensive it is to live in Safety Harbor. Real estate prices drive most of the variance in cost of living around Florida. Key points include:
The cost of living in Safety Harbor is 121 with 100 being average.
The cost of living in Safety Harbor is 1.2x higher than the national average.
The median home value in Safety Harbor is $495,956.
The median income in Safety Harbor is $106,830.
Safety Harbor's Overall Cost Of Living
Higher Than The National Average
Cost Of Living In Safety Harbor Comparison Table
| Living Expense | Safety Harbor | Florida | National Average |
|---|---|---|---|
| Overall | 121 | 104 | 100 |
| Services | 101 | 101 | 100 |
| Groceries | 102 | 105 | 100 |
| Health | 157 | 99 | 100 |
| Housing | 102 | 104 | 100 |
| Transportation | 108 | 109 | 100 |
| Utilities | 100 | 105 | 100 |
Source: Cost of living index, normalized to US average = 100
Safety Harbor, FL Weather
The average high in Safety Harbor is 81.6° and the average low is 64.9°.
There are 71.0 days of precipitation each year.
Expect an average of 51.7 inches of precipitation each year with 0.0 inches of snow.
| Stat | Safety Harbor |
|---|---|
| Average Annual High | 81.6 |
| Average Annual Low | 64.9 |
| Annual Precipitation Days | 71.0 |
| Average Annual Precipitation | 51.7 |
| Average Annual Snowfall | 0.0 |
Average High
Days of Rain
Source: NOAA climate normals (30-year)
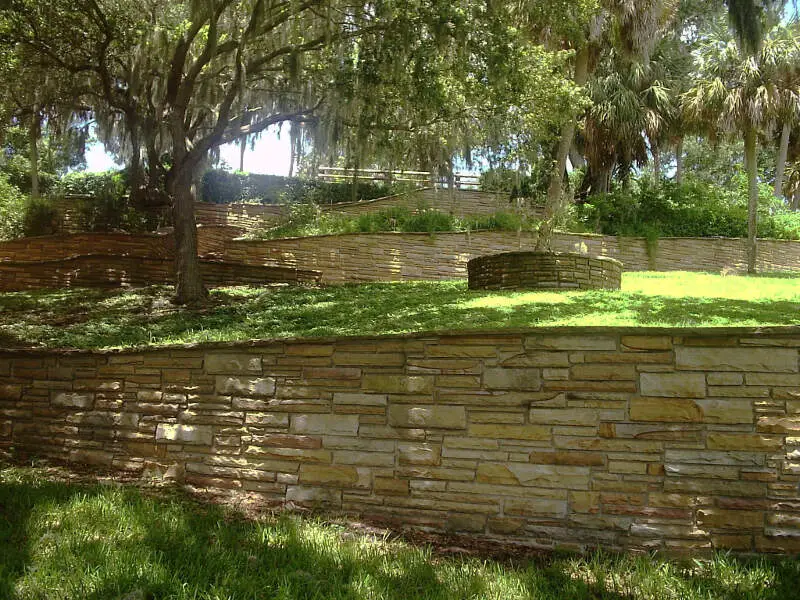
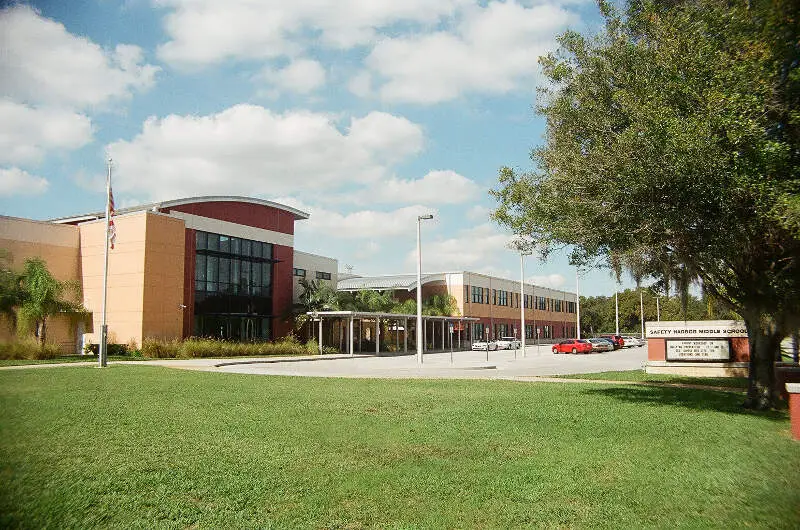
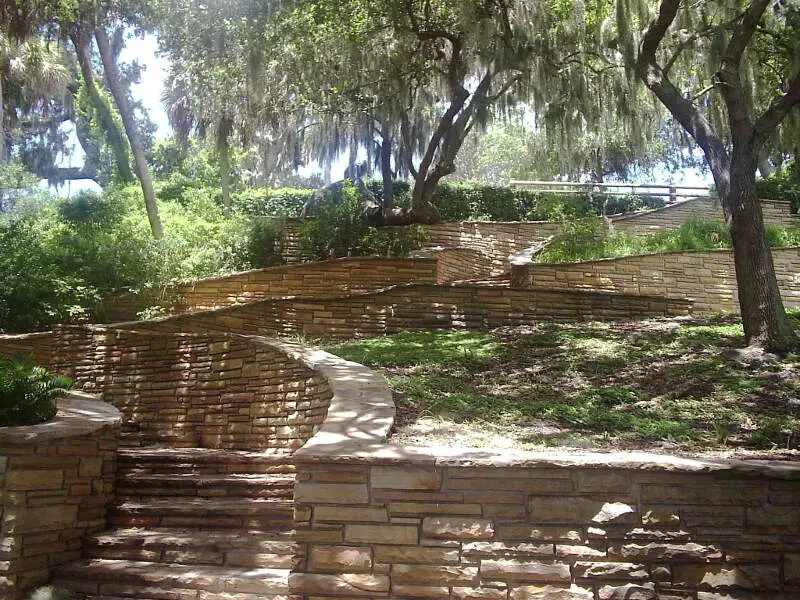
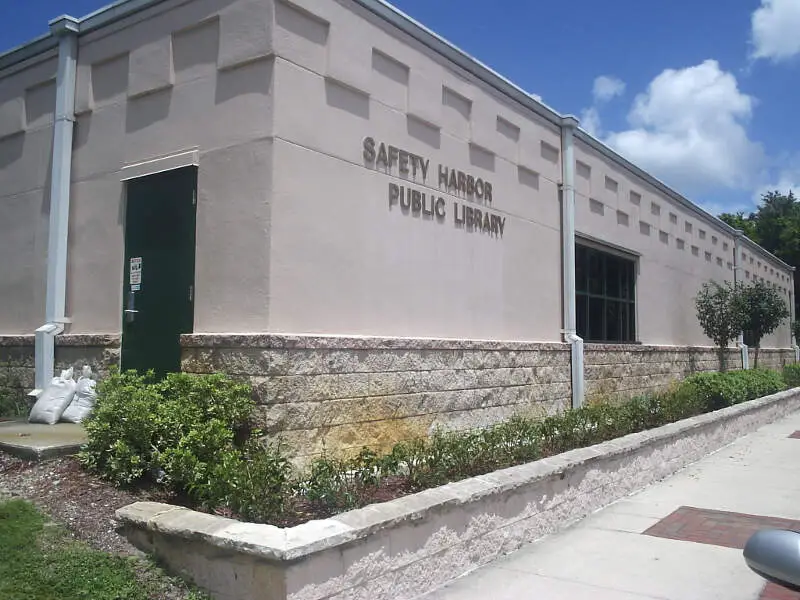
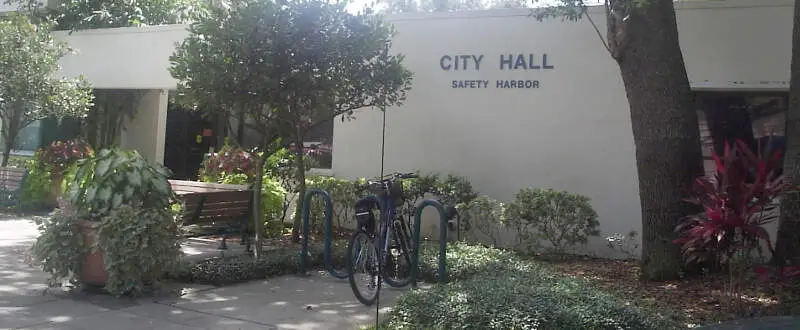
Safety Harbor, FL Photos

Rankings & Articles For Safety Harbor


Locations Around Safety Harbor
Map Of Safety Harbor, FL
Best Places Around Safety Harbor
Carrollwood, FL
Population 36,725
Pinellas Park, FL
Population 53,560
Palm Harbor, FL
Population 61,512
Northdale, FL
Population 25,710
Trinity, FL
Population 18,907
Citrus Park, FL
Population 28,804
Lutz, FL
Population 27,106
Largo, FL
Population 82,617
Keystone, FL
Population 25,858
Oldsmar, FL
Population 14,904
Safety Harbor Demographics And Statistics
Population over time in Safety Harbor
The current population in Safety Harbor is 17,033. The population has increased 0.6% from 2010.
| Year | Population | % Change |
|---|---|---|
| 2024 | 17,033 | -0.0% |
| 2023 | 17,040 | -0.3% |
| 2022 | 17,087 | -0.0% |
| 2021 | 17,093 | -4.5% |
| 2020 | 17,893 | 0.5% |
| 2019 | 17,803 | 0.8% |
| 2018 | 17,663 | 1.0% |
| 2017 | 17,484 | 1.3% |
| 2016 | 17,268 | 0.7% |
| 2015 | 17,142 | 0.7% |
| 2014 | 17,017 | 0.5% |
| 2013 | 16,937 | 0.2% |
| 2012 | 16,903 | -0.1% |
| 2011 | 16,913 | -0.1% |
| 2010 | 16,934 | - |
Race / Ethnicity in Safety Harbor
See the full breakdown
Safety Harbor is:
72.9% White with 12,425 White residents.
6.9% African American with 1,171 African American residents.
0.0% American Indian with 4 American Indian residents.
2.1% Asian with 364 Asian residents.
0.0% Hawaiian with 0 Hawaiian residents.
1.6% Other with 272 Other residents.
6.4% Two Or More with 1,092 Two Or More residents.
10.0% Hispanic with 1,705 Hispanic residents.
| Race | Safety Harbor | FL | USA |
|---|---|---|---|
| White | 72.9% | 50.4% | 57.4% |
| African American | 6.9% | 14.6% | 11.9% |
| American Indian | 0.0% | 0.1% | 0.5% |
| Asian | 2.1% | 2.9% | 5.9% |
| Hawaiian | 0.0% | 0.1% | 0.2% |
| Other | 1.6% | 0.7% | 0.6% |
| Two Or More | 6.4% | 3.8% | 4.3% |
| Hispanic | 10.0% | 27.4% | 19.3% |
Gender in Safety Harbor
See the full breakdown
Safety Harbor is 52.8% female with 9,000 female residents.
Safety Harbor is 47.2% male with 8,032 male residents.
| Gender | Safety Harbor | FL | USA |
|---|---|---|---|
| Female | 52.8% | 50.9% | 50.5% |
| Male | 47.2% | 49.1% | 49.5% |
Highest level of educational attainment in Safety Harbor for adults over 25
See the full breakdown
1.0% of adults in Safety Harbor completed < 9th grade.
2.0% of adults in Safety Harbor completed 9-12th grade.
21.0% of adults in Safety Harbor completed high school / ged.
16.0% of adults in Safety Harbor completed some college.
11.0% of adults in Safety Harbor completed associate's degree.
32.0% of adults in Safety Harbor completed bachelor's degree.
12.0% of adults in Safety Harbor completed master's degree.
4.0% of adults in Safety Harbor completed professional degree.
1.0% of adults in Safety Harbor completed doctorate degree.
| Education | Safety Harbor | FL | USA |
|---|---|---|---|
| < 9th Grade | 1.0% | 5.0% | 4.0% |
| 9-12th Grade | 2.0% | 6.0% | 6.0% |
| High School / GED | 21.0% | 27.0% | 26.0% |
| Some College | 16.0% | 19.0% | 19.0% |
| Associate's Degree | 11.0% | 10.0% | 9.0% |
| Bachelor's Degree | 32.0% | 21.0% | 22.0% |
| Master's Degree | 12.0% | 9.0% | 10.0% |
| Professional Degree | 4.0% | 2.0% | 2.0% |
| Doctorate Degree | 1.0% | 1.0% | 2.0% |
Household Income For Safety Harbor, Florida
See the full breakdown
3.3% of households in Safety Harbor earn Less than $10,000.
2.1% of households in Safety Harbor earn $10,000 to $14,999.
5.3% of households in Safety Harbor earn $15,000 to $24,999.
8.1% of households in Safety Harbor earn $25,000 to $34,999.
7.4% of households in Safety Harbor earn $35,000 to $49,999.
12.6% of households in Safety Harbor earn $50,000 to $74,999.
9.9% of households in Safety Harbor earn $75,000 to $99,999.
17.0% of households in Safety Harbor earn $100,000 to $149,999.
12.7% of households in Safety Harbor earn $150,000 to $199,999.
21.5% of households in Safety Harbor earn $200,000 or more.
| Income | Safety Harbor | FL | USA |
|---|---|---|---|
| Less than $10,000 | 3.3% | 5.1% | 5.0% |
| $10,000 to $14,999 | 2.1% | 3.3% | 3.4% |
| $15,000 to $24,999 | 5.3% | 6.6% | 6.3% |
| $25,000 to $34,999 | 8.1% | 7.3% | 6.6% |
| $35,000 to $49,999 | 7.4% | 11.1% | 10.1% |
| $50,000 to $74,999 | 12.6% | 16.8% | 15.5% |
| $75,000 to $99,999 | 9.9% | 13.1% | 12.6% |
| $100,000 to $149,999 | 17.0% | 17.2% | 17.5% |
| $150,000 to $199,999 | 12.7% | 8.4% | 9.6% |
| $200,000 or more | 21.5% | 11.0% | 13.4% |
Source: U.S. Census ACS 5-year estimates (2024)


