Surfside SnackAbility
Overall SnackAbility
Crime in Surfside summary. We use data from the FBI to determine the crime rates in Surfside. Key points include:
There were 154 total crimes in Surfside in the last reporting year.
The overall crime rate per 100,000 people in Surfside is 2,849.2 / 100k people.
The violent crime rate per 100,000 people in Surfside is 111.0 / 100k people.
The property crime rate per 100,000 people in Surfside is 2,738.2 / 100k people.
Overall, crime in Surfside is 34.45% above the national average.
Total Crimes
Above National Average
Crime In Surfside Comparison Table
| Statistic | Count Raw |
Surfside / 100k People |
Florida / 100k People |
National / 100k People |
|---|---|---|---|---|
| Total Crimes Per 100K | 154 | 2,849.2 | 1,687.5 | 2,119.2 |
| Violent Crime | 6 | 111.0 | 267.1 | 359.0 |
| Murder | 0 | 0.0 | 3.9 | 5.0 |
| Robbery | 2 | 37.0 | 38.2 | 61.0 |
| Aggravated Assault | 4 | 74.0 | 197.1 | 256.0 |
| Property Crime | 148 | 2,738.2 | 1,420.4 | 1,760.0 |
| Burglary | 15 | 277.5 | 152.5 | 229.0 |
| Larceny | 126 | 2,331.2 | 1,144.9 | 1,272.0 |
| Car Theft | 7 | 129.5 | 123.0 | 259.0 |
Source: FBI Uniform Crime Reporting (2024)
Cost of living in Surfside summary. We use data on the cost of living to determine how expensive it is to live in Surfside. Real estate prices drive most of the variance in cost of living around Florida. Key points include:
The cost of living in Surfside is 159 with 100 being average.
The cost of living in Surfside is 1.6x higher than the national average.
The median home value in Surfside is $1,276,757.
The median income in Surfside is $100,208.
Surfside's Overall Cost Of Living
Higher Than The National Average
Cost Of Living In Surfside Comparison Table
| Living Expense | Surfside | Florida | National Average |
|---|---|---|---|
| Overall | 159 | 104 | 100 |
| Services | 102 | 101 | 100 |
| Groceries | 109 | 105 | 100 |
| Health | 287 | 99 | 100 |
| Housing | 101 | 104 | 100 |
| Transportation | 111 | 109 | 100 |
| Utilities | 102 | 105 | 100 |
Source: Cost of living index, normalized to US average = 100
Surfside, FL Weather
The average high in Surfside is 82.5° and the average low is 70.5°.
There are 73.7 days of precipitation each year.
Expect an average of 58.4 inches of precipitation each year with 0.0 inches of snow.
| Stat | Surfside |
|---|---|
| Average Annual High | 82.5 |
| Average Annual Low | 70.5 |
| Annual Precipitation Days | 73.7 |
| Average Annual Precipitation | 58.4 |
| Average Annual Snowfall | 0.0 |
Average High
Days of Rain
Source: NOAA climate normals (30-year)
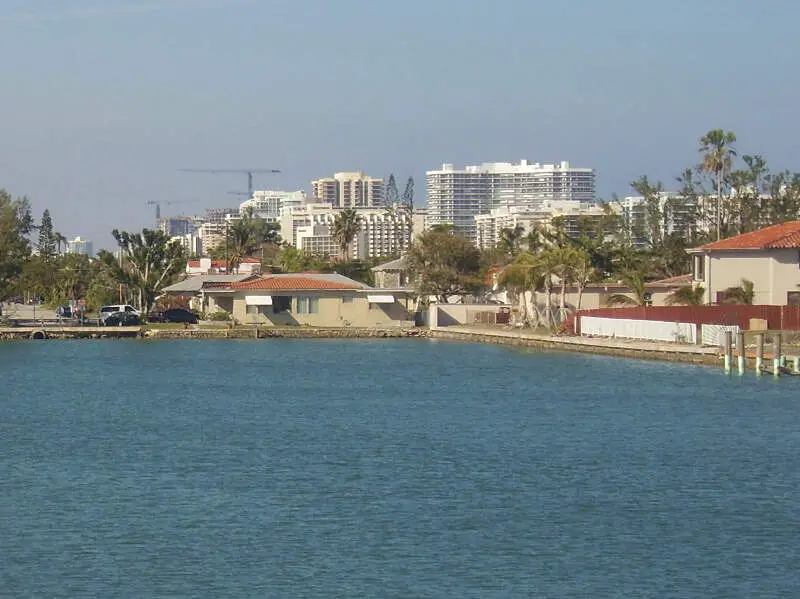
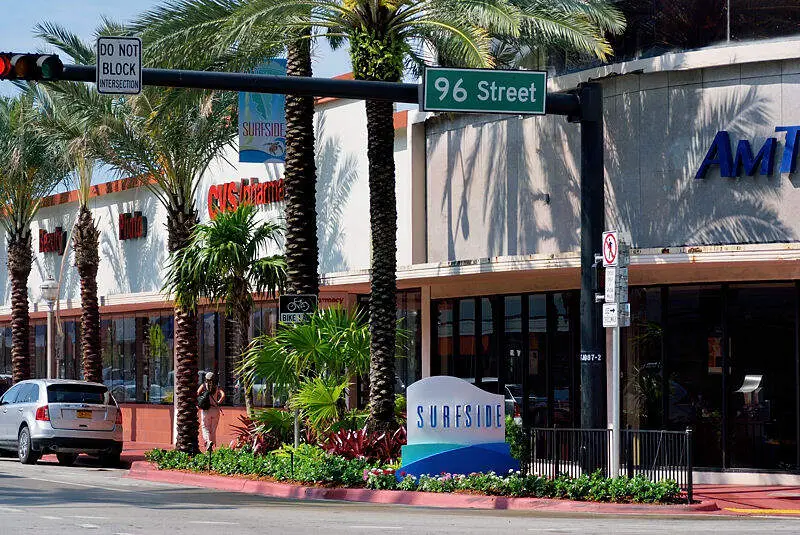
Surfside, FL Photos
Rankings & Articles For Surfside


Locations Around Surfside
Map Of Surfside, FL
Best Places Around Surfside
Coral Gables, FL
Population 49,802
Coral Terrace, FL
Population 24,895
Sunset, FL
Population 13,535
Pembroke Pines, FL
Population 173,194
Miami Lakes, FL
Population 31,553
Tamiami, FL
Population 49,752
Key Biscayne, FL
Population 14,791
Olympia Heights, FL
Population 12,399
Davie, FL
Population 108,346
Westwood Lakes, FL
Population 10,553
Surfside Demographics And Statistics
Population over time in Surfside
The current population in Surfside is 5,631. The population has increased 1.5% from 2010.
| Year | Population | % Change |
|---|---|---|
| 2024 | 5,631 | 1.2% |
| 2023 | 5,566 | -1.0% |
| 2022 | 5,625 | -0.7% |
| 2021 | 5,665 | 0.0% |
| 2020 | 5,665 | -1.0% |
| 2019 | 5,725 | -1.6% |
| 2018 | 5,817 | -0.5% |
| 2017 | 5,844 | 0.6% |
| 2016 | 5,810 | -3.0% |
| 2015 | 5,987 | 1.0% |
| 2014 | 5,927 | 1.5% |
| 2013 | 5,839 | 1.6% |
| 2012 | 5,748 | 1.7% |
| 2011 | 5,654 | 1.9% |
| 2010 | 5,548 | - |
Race / Ethnicity in Surfside
See the full breakdown
Surfside is:
60.9% White with 3,431 White residents.
4.3% African American with 242 African American residents.
0.6% American Indian with 31 American Indian residents.
1.4% Asian with 79 Asian residents.
0.0% Hawaiian with 0 Hawaiian residents.
0.2% Other with 10 Other residents.
3.7% Two Or More with 208 Two Or More residents.
28.9% Hispanic with 1,630 Hispanic residents.
| Race | Surfside | FL | USA |
|---|---|---|---|
| White | 60.9% | 50.4% | 57.4% |
| African American | 4.3% | 14.6% | 11.9% |
| American Indian | 0.6% | 0.1% | 0.5% |
| Asian | 1.4% | 2.9% | 5.9% |
| Hawaiian | 0.0% | 0.1% | 0.2% |
| Other | 0.2% | 0.7% | 0.6% |
| Two Or More | 3.7% | 3.8% | 4.3% |
| Hispanic | 28.9% | 27.4% | 19.3% |
Gender in Surfside
See the full breakdown
Surfside is 58.7% female with 3,304 female residents.
Surfside is 41.3% male with 2,327 male residents.
| Gender | Surfside | FL | USA |
|---|---|---|---|
| Female | 58.7% | 50.9% | 50.5% |
| Male | 41.3% | 49.1% | 49.5% |
Highest level of educational attainment in Surfside for adults over 25
See the full breakdown
-0.0% of adults in Surfside completed < 9th grade.
2.0% of adults in Surfside completed 9-12th grade.
22.0% of adults in Surfside completed high school / ged.
12.0% of adults in Surfside completed some college.
6.0% of adults in Surfside completed associate's degree.
27.0% of adults in Surfside completed bachelor's degree.
21.0% of adults in Surfside completed master's degree.
7.0% of adults in Surfside completed professional degree.
3.0% of adults in Surfside completed doctorate degree.
| Education | Surfside | FL | USA |
|---|---|---|---|
| < 9th Grade | -0.0% | 5.0% | 4.0% |
| 9-12th Grade | 2.0% | 6.0% | 6.0% |
| High School / GED | 22.0% | 27.0% | 26.0% |
| Some College | 12.0% | 19.0% | 19.0% |
| Associate's Degree | 6.0% | 10.0% | 9.0% |
| Bachelor's Degree | 27.0% | 21.0% | 22.0% |
| Master's Degree | 21.0% | 9.0% | 10.0% |
| Professional Degree | 7.0% | 2.0% | 2.0% |
| Doctorate Degree | 3.0% | 1.0% | 2.0% |
Household Income For Surfside, Florida
See the full breakdown
6.0% of households in Surfside earn Less than $10,000.
1.0% of households in Surfside earn $10,000 to $14,999.
1.6% of households in Surfside earn $15,000 to $24,999.
10.9% of households in Surfside earn $25,000 to $34,999.
5.2% of households in Surfside earn $35,000 to $49,999.
8.1% of households in Surfside earn $50,000 to $74,999.
17.2% of households in Surfside earn $75,000 to $99,999.
12.6% of households in Surfside earn $100,000 to $149,999.
13.8% of households in Surfside earn $150,000 to $199,999.
23.7% of households in Surfside earn $200,000 or more.
| Income | Surfside | FL | USA |
|---|---|---|---|
| Less than $10,000 | 6.0% | 5.1% | 5.0% |
| $10,000 to $14,999 | 1.0% | 3.3% | 3.4% |
| $15,000 to $24,999 | 1.6% | 6.6% | 6.3% |
| $25,000 to $34,999 | 10.9% | 7.3% | 6.6% |
| $35,000 to $49,999 | 5.2% | 11.1% | 10.1% |
| $50,000 to $74,999 | 8.1% | 16.8% | 15.5% |
| $75,000 to $99,999 | 17.2% | 13.1% | 12.6% |
| $100,000 to $149,999 | 12.6% | 17.2% | 17.5% |
| $150,000 to $199,999 | 13.8% | 8.4% | 9.6% |
| $200,000 or more | 23.7% | 11.0% | 13.4% |
Source: U.S. Census ACS 5-year estimates (2024)


